Instrumenting Any Application for Custom metric using Prometheus.

Hi there 🙋🏻♂️, I'm Shubham, I'm a Software Developer and Enjoy writing technical blogs. Open to learning new things and collaborating. if you have any doubts I can put clarity on please ping me on any social. 😄 If you are interested please visit https://shubhamdeshmukh.com https://www.linkedin.com/in/shubhamdeshmukh2995/
Today in this blog we will be learning how to add monitoring support to our Go application. Before starting we will learn more about Prometheus.
What is Prometheus ?
Prometheus is an open-source system monitoring and alerting tool. Prometheus collects and stores its metrics as time-series data, i.e. metrics information is stored with the timestamp at which it was recorded, alongside optional key-value pairs called labels. Now we have some idea about what Prometheus is !! Let's start the implementation.
1. Installing Prometheus libraries.
Run the below commands to install Prometheus libraries.
go get github.com/prometheus/client_golang/prometheus
go get github.com/prometheus/client_golang/prometheus/promauto
go get github.com/prometheus/client_golang/prometheus/promhttp
2. Writing the Go application.
We will implement Prometheus libraries in our Go code. To expose Prometheus metrics, We need to provide a /metrics HTTP endpoint. We will use promhttp as the handler function. This will expose the metrics at,
http://localhost:8080/metrics
We have added a custom metric called "my_custom_metric" which will increment its value after every 5 seconds.
package main

import (
        "net/http"
        "time"

        "github.com/prometheus/client_golang/prometheus"
        "github.com/prometheus/client_golang/prometheus/promauto"
        "github.com/prometheus/client_golang/prometheus/promhttp"
)

func recordCustomMetrics() {
        go func() {
                for {
                        mymetric.Inc()
                        time.Sleep(5 * time.Second)
                }
        }()
}

var (
        mymetric = promauto.NewCounter(prometheus.CounterOpts{
                Name: "my_custom_metric",
                Help: "total number for my custom action",
        })
)

func main() {
        recordCustomMetrics()
        http.Handle("/metrics", promhttp.Handler())
        http.ListenAndServe(":8080", nil)
}
3. Running the Application and verifying the metric.
Execute the below command to run the application.
go run main.go
After the application is started we can hit http://localhost:8080/metrics to check for metrics.
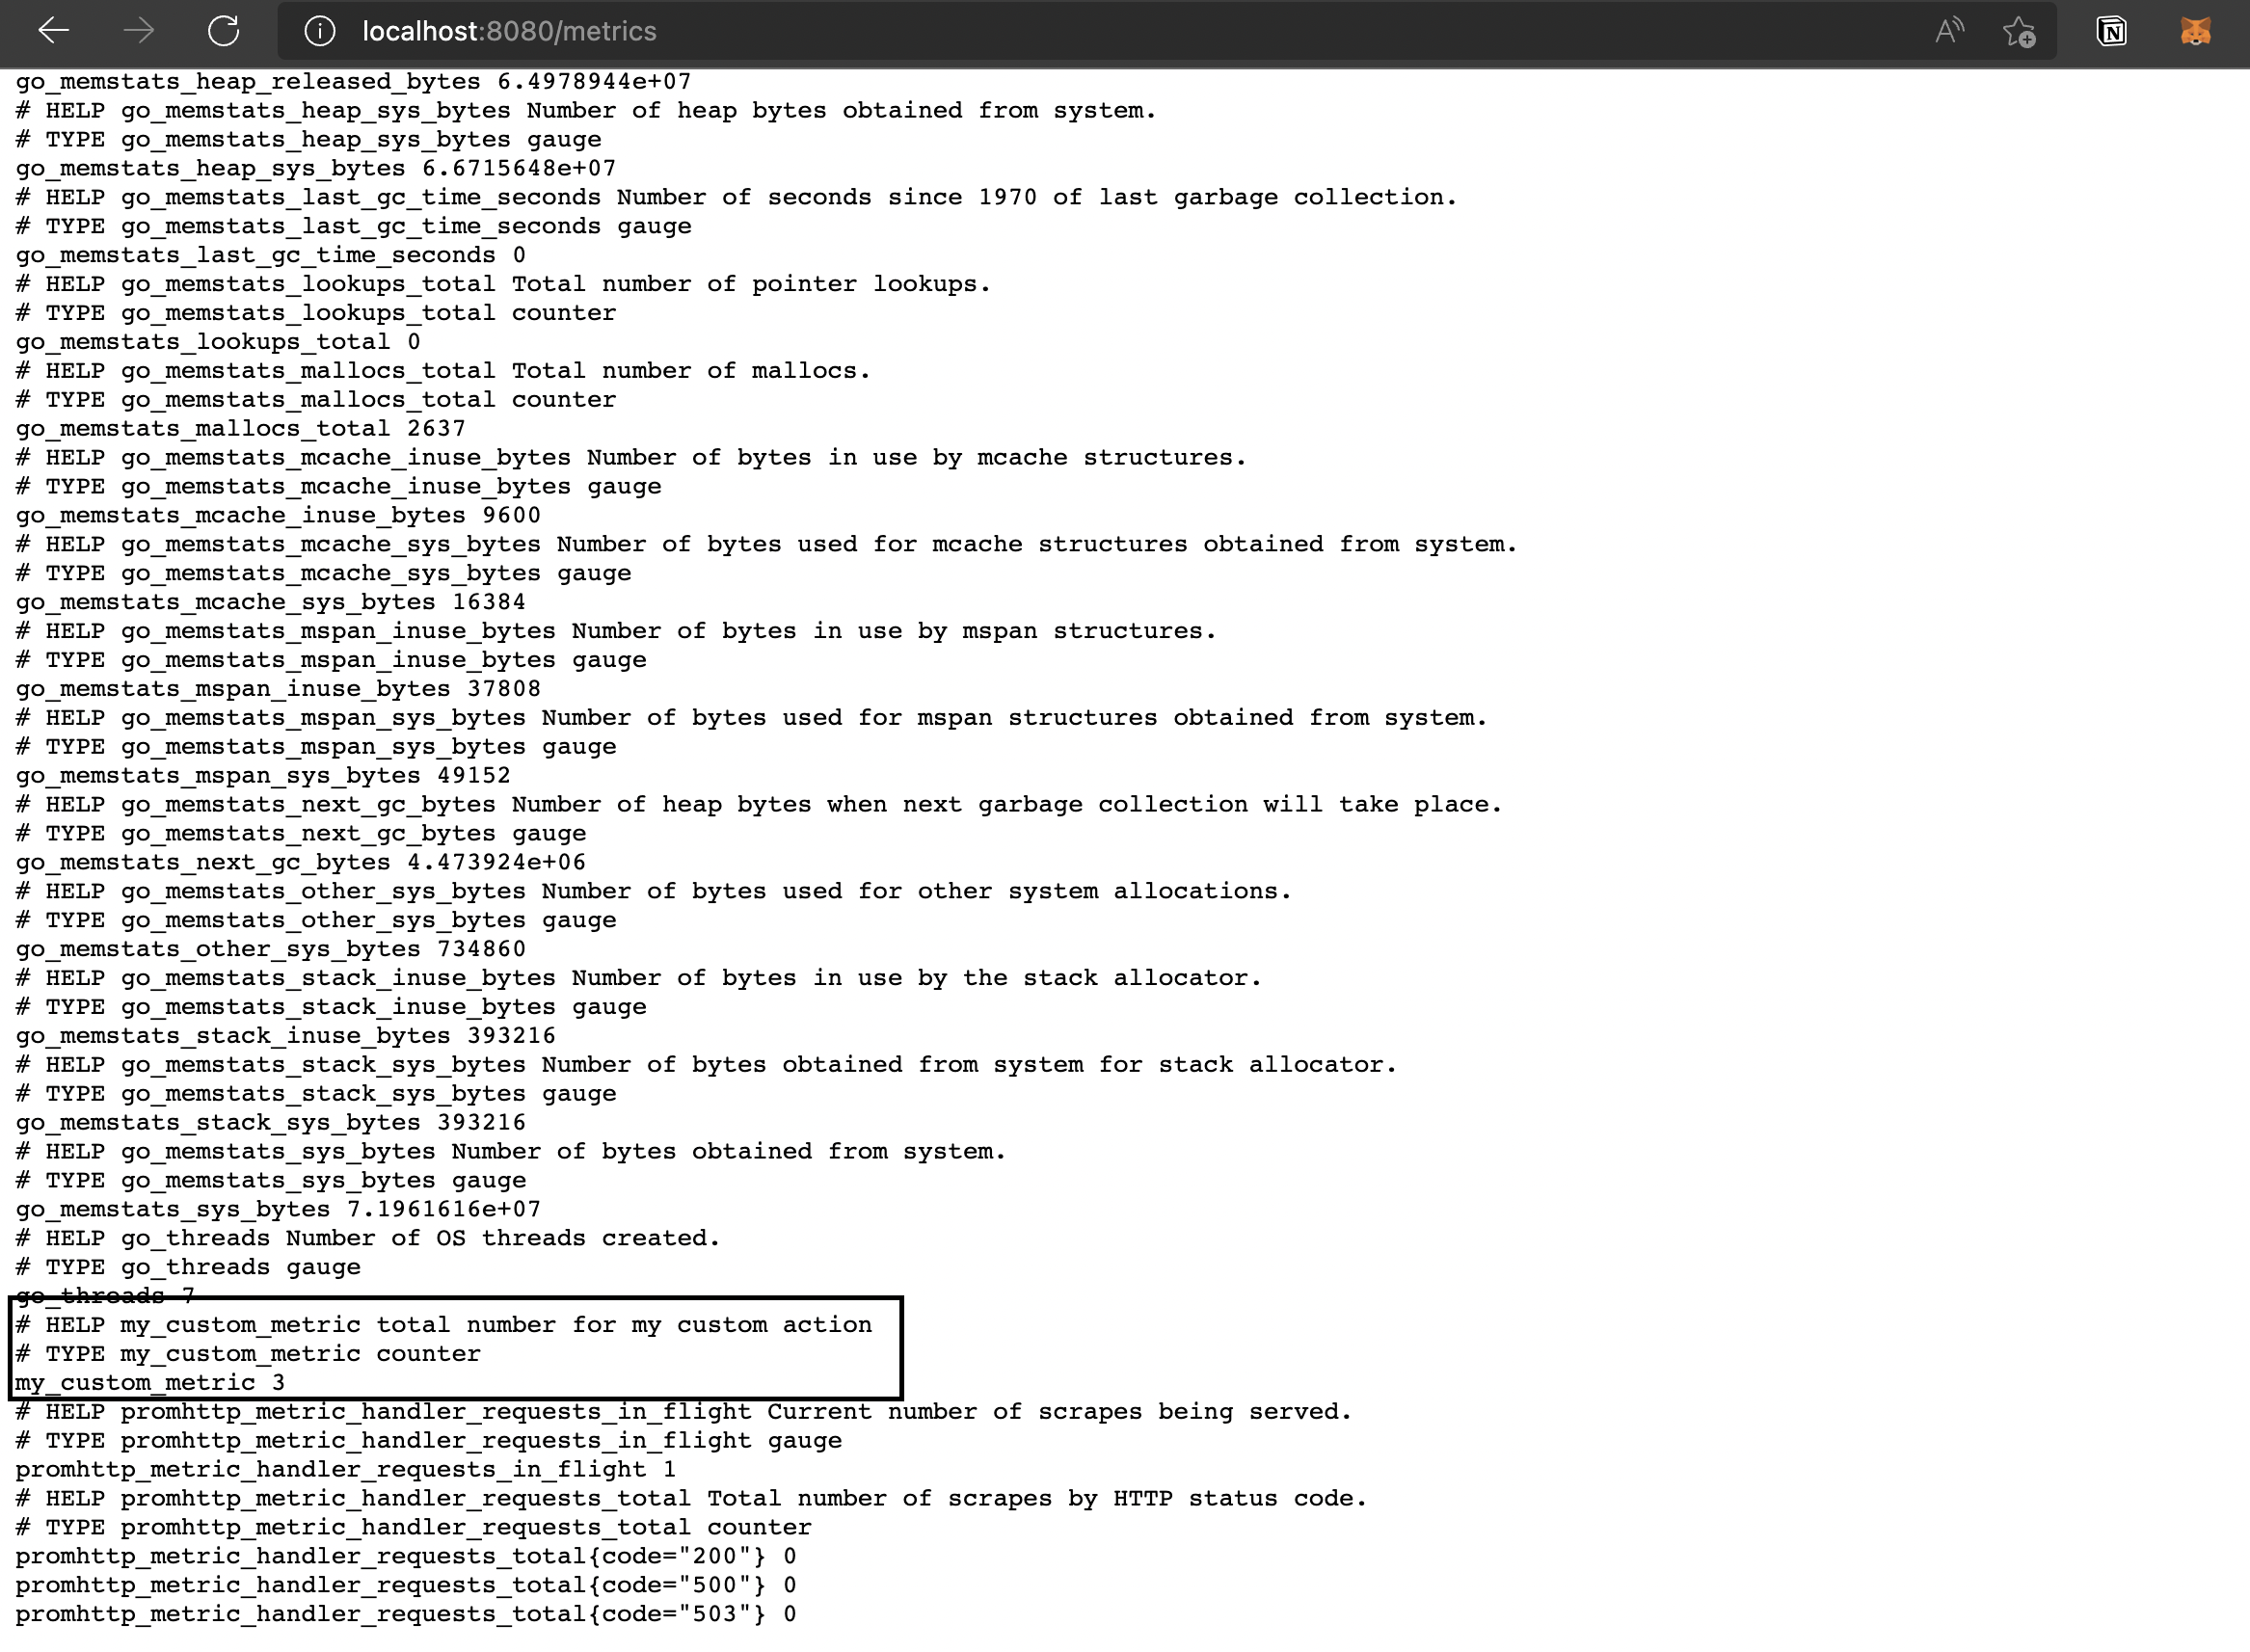 As we can see the metric is visible in the metrics section.
For more information on Prometheus visit, https://prometheus.io/
Thanks for reading. Hope you have a great day 😁