


Table of contents
Hello Friend's, Today in this blog we will be configuring Grafana with Prometheus. Before Starting you should have an understanding of what Prometheus is and how to configure it, If you are new to Prometheus please visit this link to understand how you can instrument Prometheus into your application.
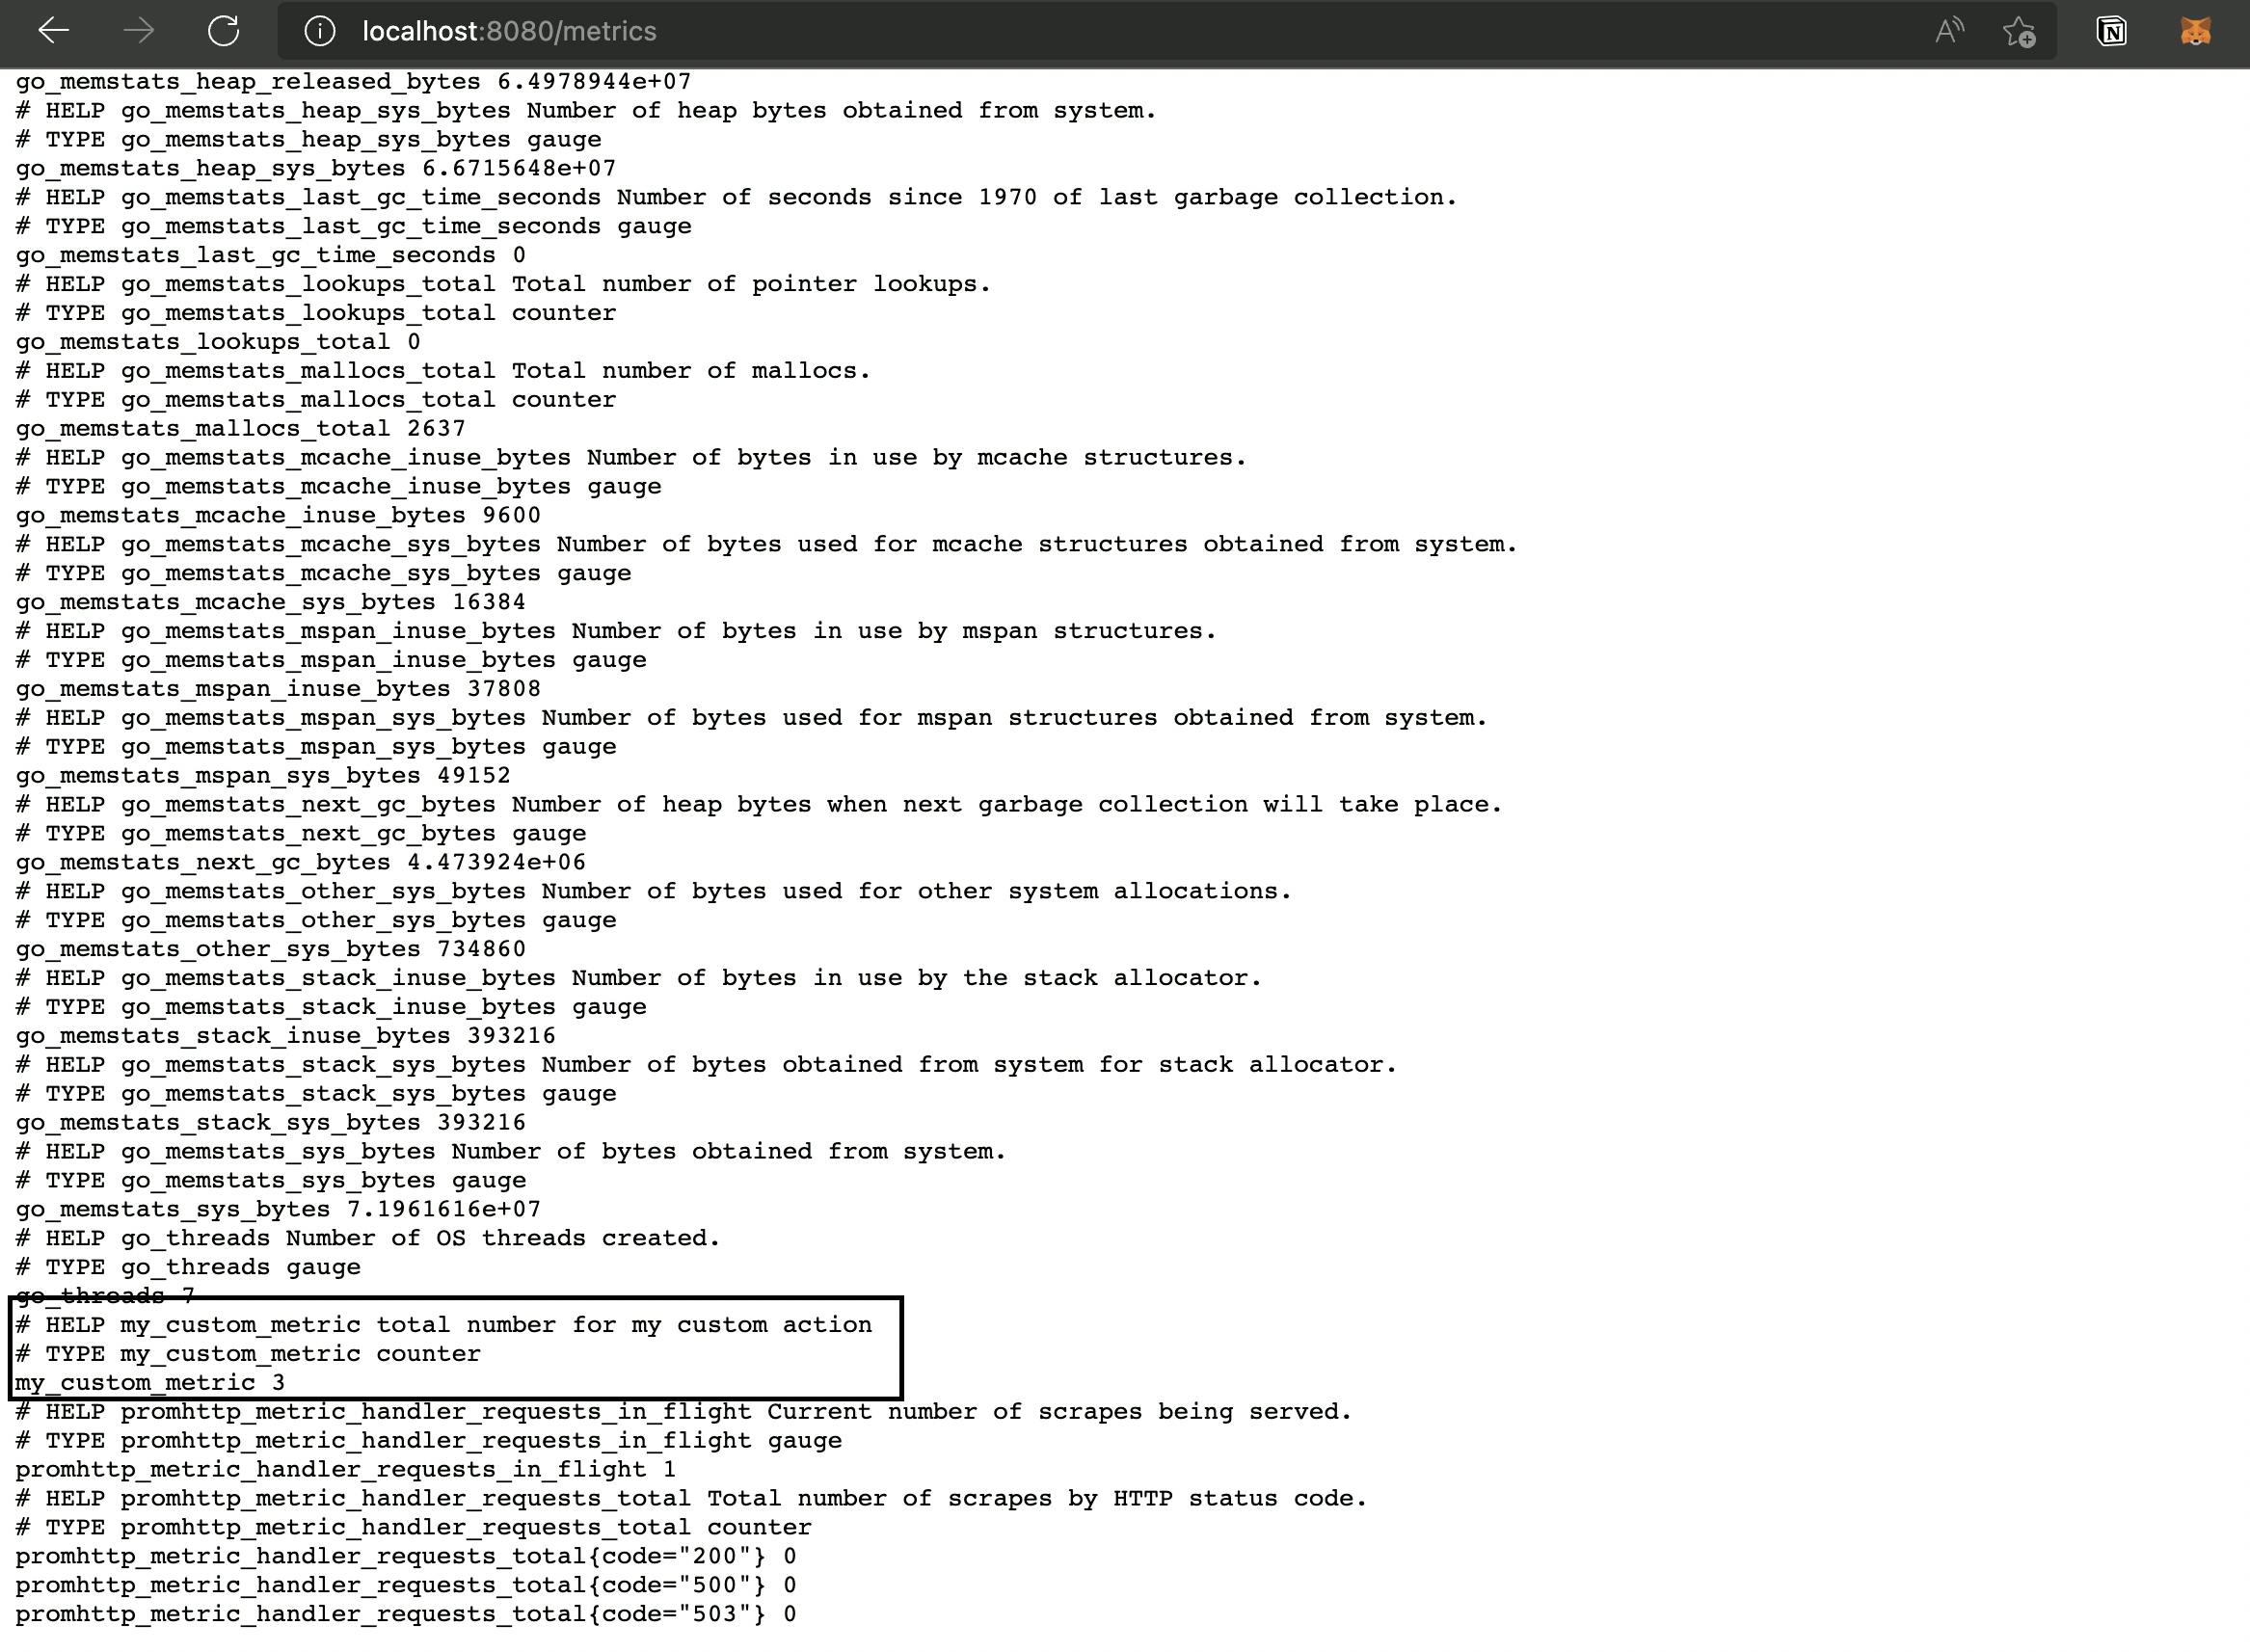
I assume that you have an application that emits data at /metrics by implementing the Prometheus library. if not please visit this link for implementing the Prometheus library in your application. The below image shows us sample output from /metrics.
Let's understand the overall picture of how the metrics will be fetched from your application and then visualized in Grafana.

- The application metrics will be available at /metrics
- Prometheus will pull the metrics from the application at regular interval
- Grafana will be configured with Prometheus data source which can then be visualized.
Let's start the real implementation now
1. first, make sure that our application whose metric we want to monitor is up and running and the metrics are available at /metrics.
2. Creating Prometheus properties file.
prometheus.yml
---------------------------------------------------------------
global:
  scrape_interval: 15s
  scrape_timeout: 10s
  evaluation_interval: 15s
scrape_configs:
  - job_name: prometheus
    honor_timestamps: true
    scrape_interval: 15s
    scrape_timeout: 10s
    metrics_path: /metrics
    scheme: http
    static_configs:
      - targets:
          - docker.for.mac.localhost:8080 // add your application host name.
The above file has the details regarding what application metrics to be fetched and what interval. You can configure it according to your requirement.
As we will be using Docker to deploy Prometheus and Grafana, We have used docker.for.mac.localhost as our host. you will be using a proper domain name or IPs when configuring production applications. You can add multiple target hosts in the configuration.
save the prometheus.yml file and note the path for that file. We will use that when running Prometheus.
3. Running Prometheus.
Run the below command to start a Prometheus instance.
docker run \
    -p 9090:9090 \
    -v /etc/prometheus.yml:/etc/prometheus/prometheus.yml \
    prom/prometheus
After running the command, the Prometheus server will spin up and start pulling the metrics from our application. To verify that our Prometheus server is running as expected we will check the Prometheus console(localhost:9090).
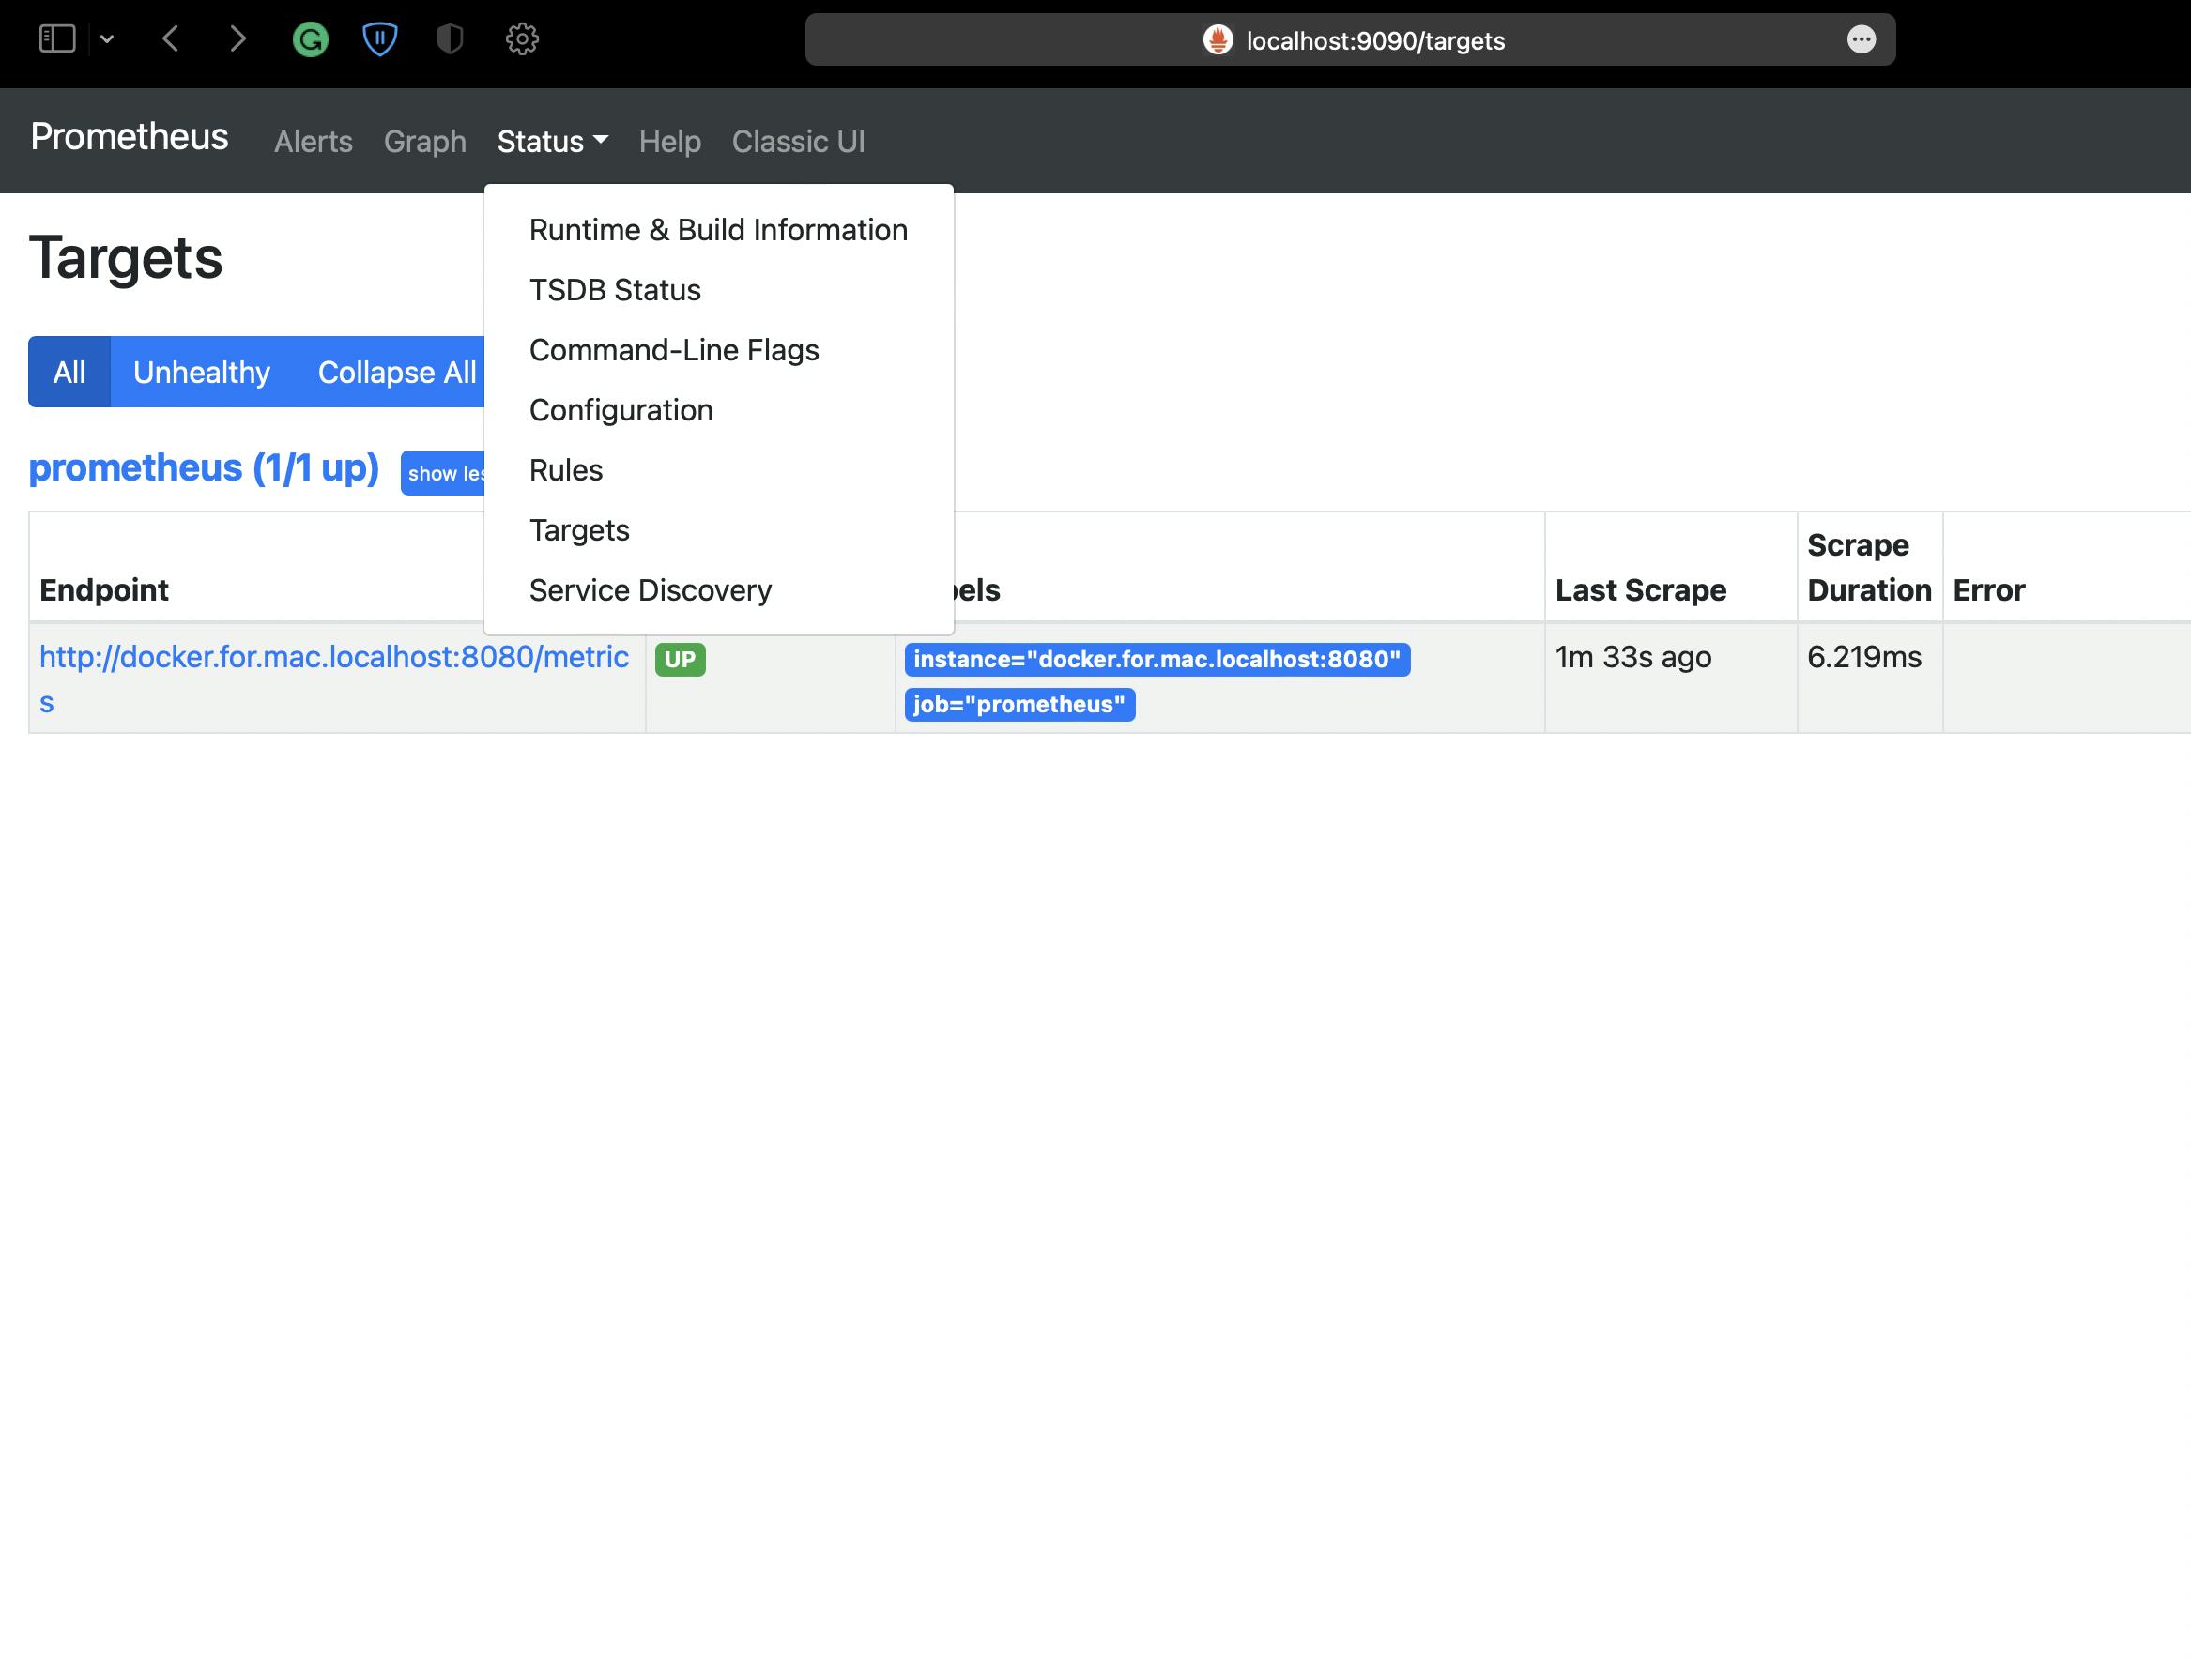
We will navigate to Status>Targets. The state must be UP, if the state is different please check your prometheus.yml and correct it. you can also check the Prometheus config at localhost:9090/config.
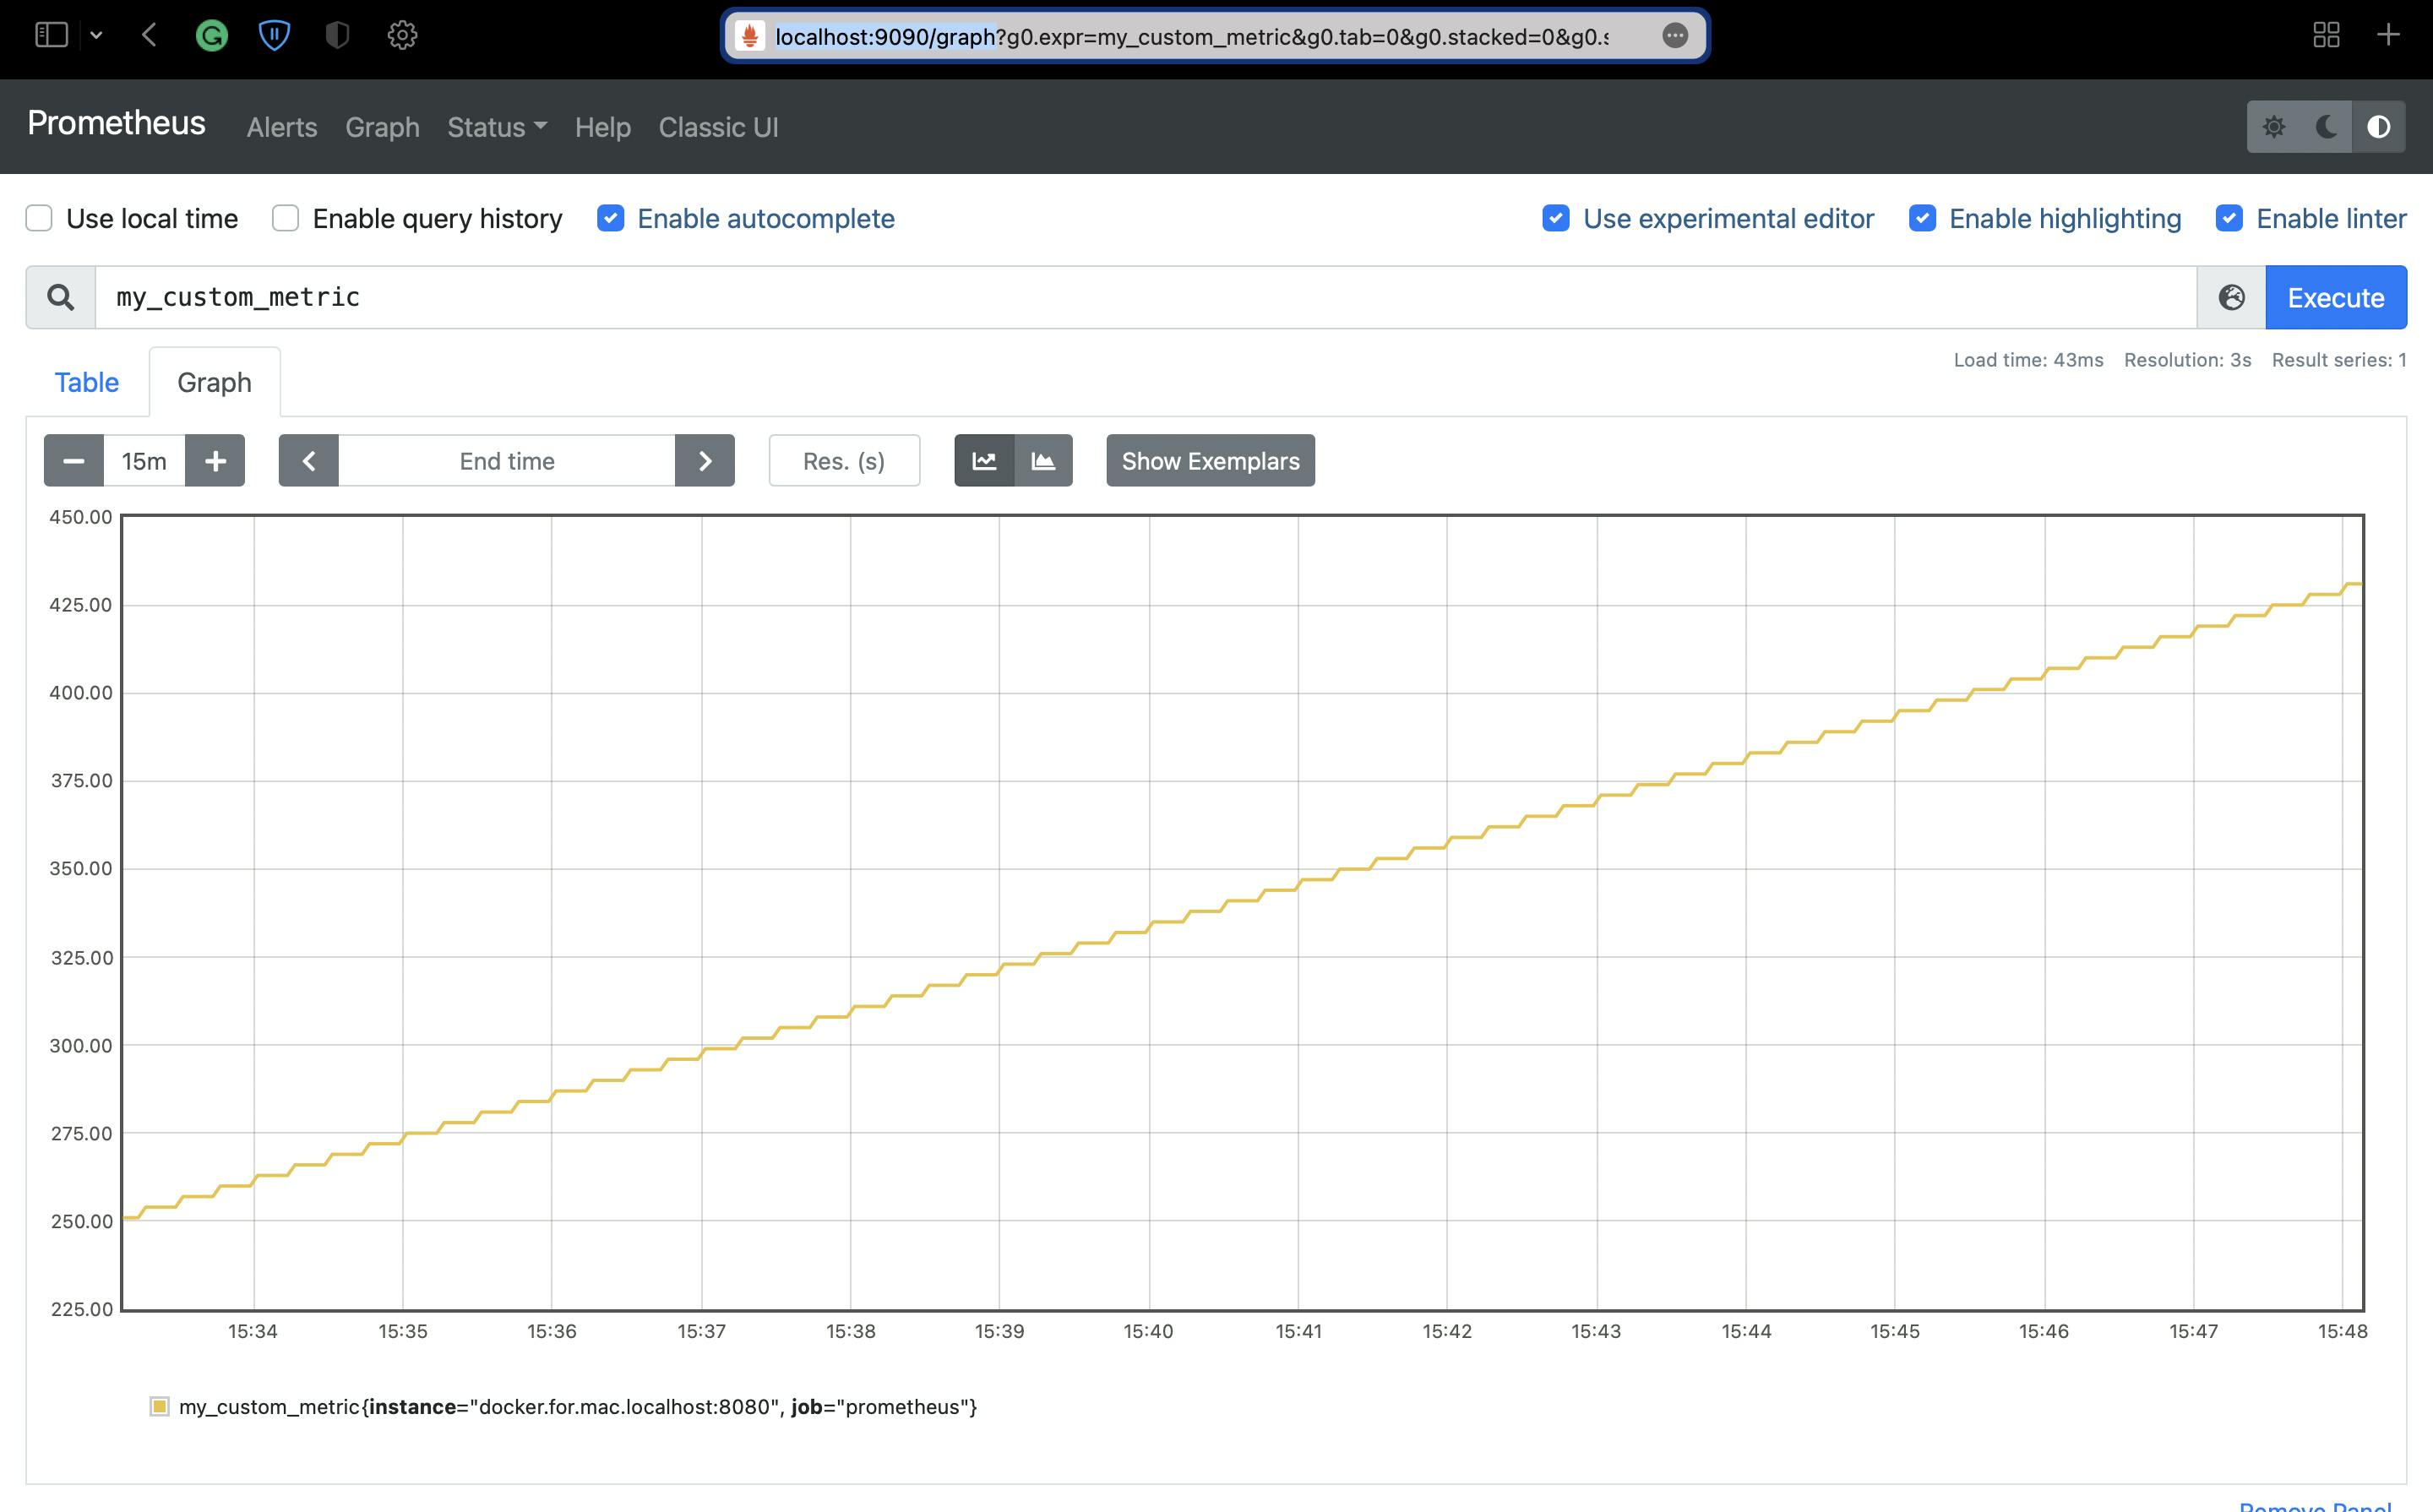
Now that our Prometheus is configured we will search our metrics. You can visit localhost:9090/graph to check for metrics if they are fetched correctly.
4. Configuring Grafana.
We can start a Grafana instance by executing the below command. This will expose Grafana at port 3000
docker run -d -p 3000:3000 grafana/grafana:latest
Now, visit localhost:3000/login.
Login id and password are admin by default. Once you are logged in we will add a data source.
Navigate to Configuration>Data source. Click on the add data source button and add the below details.
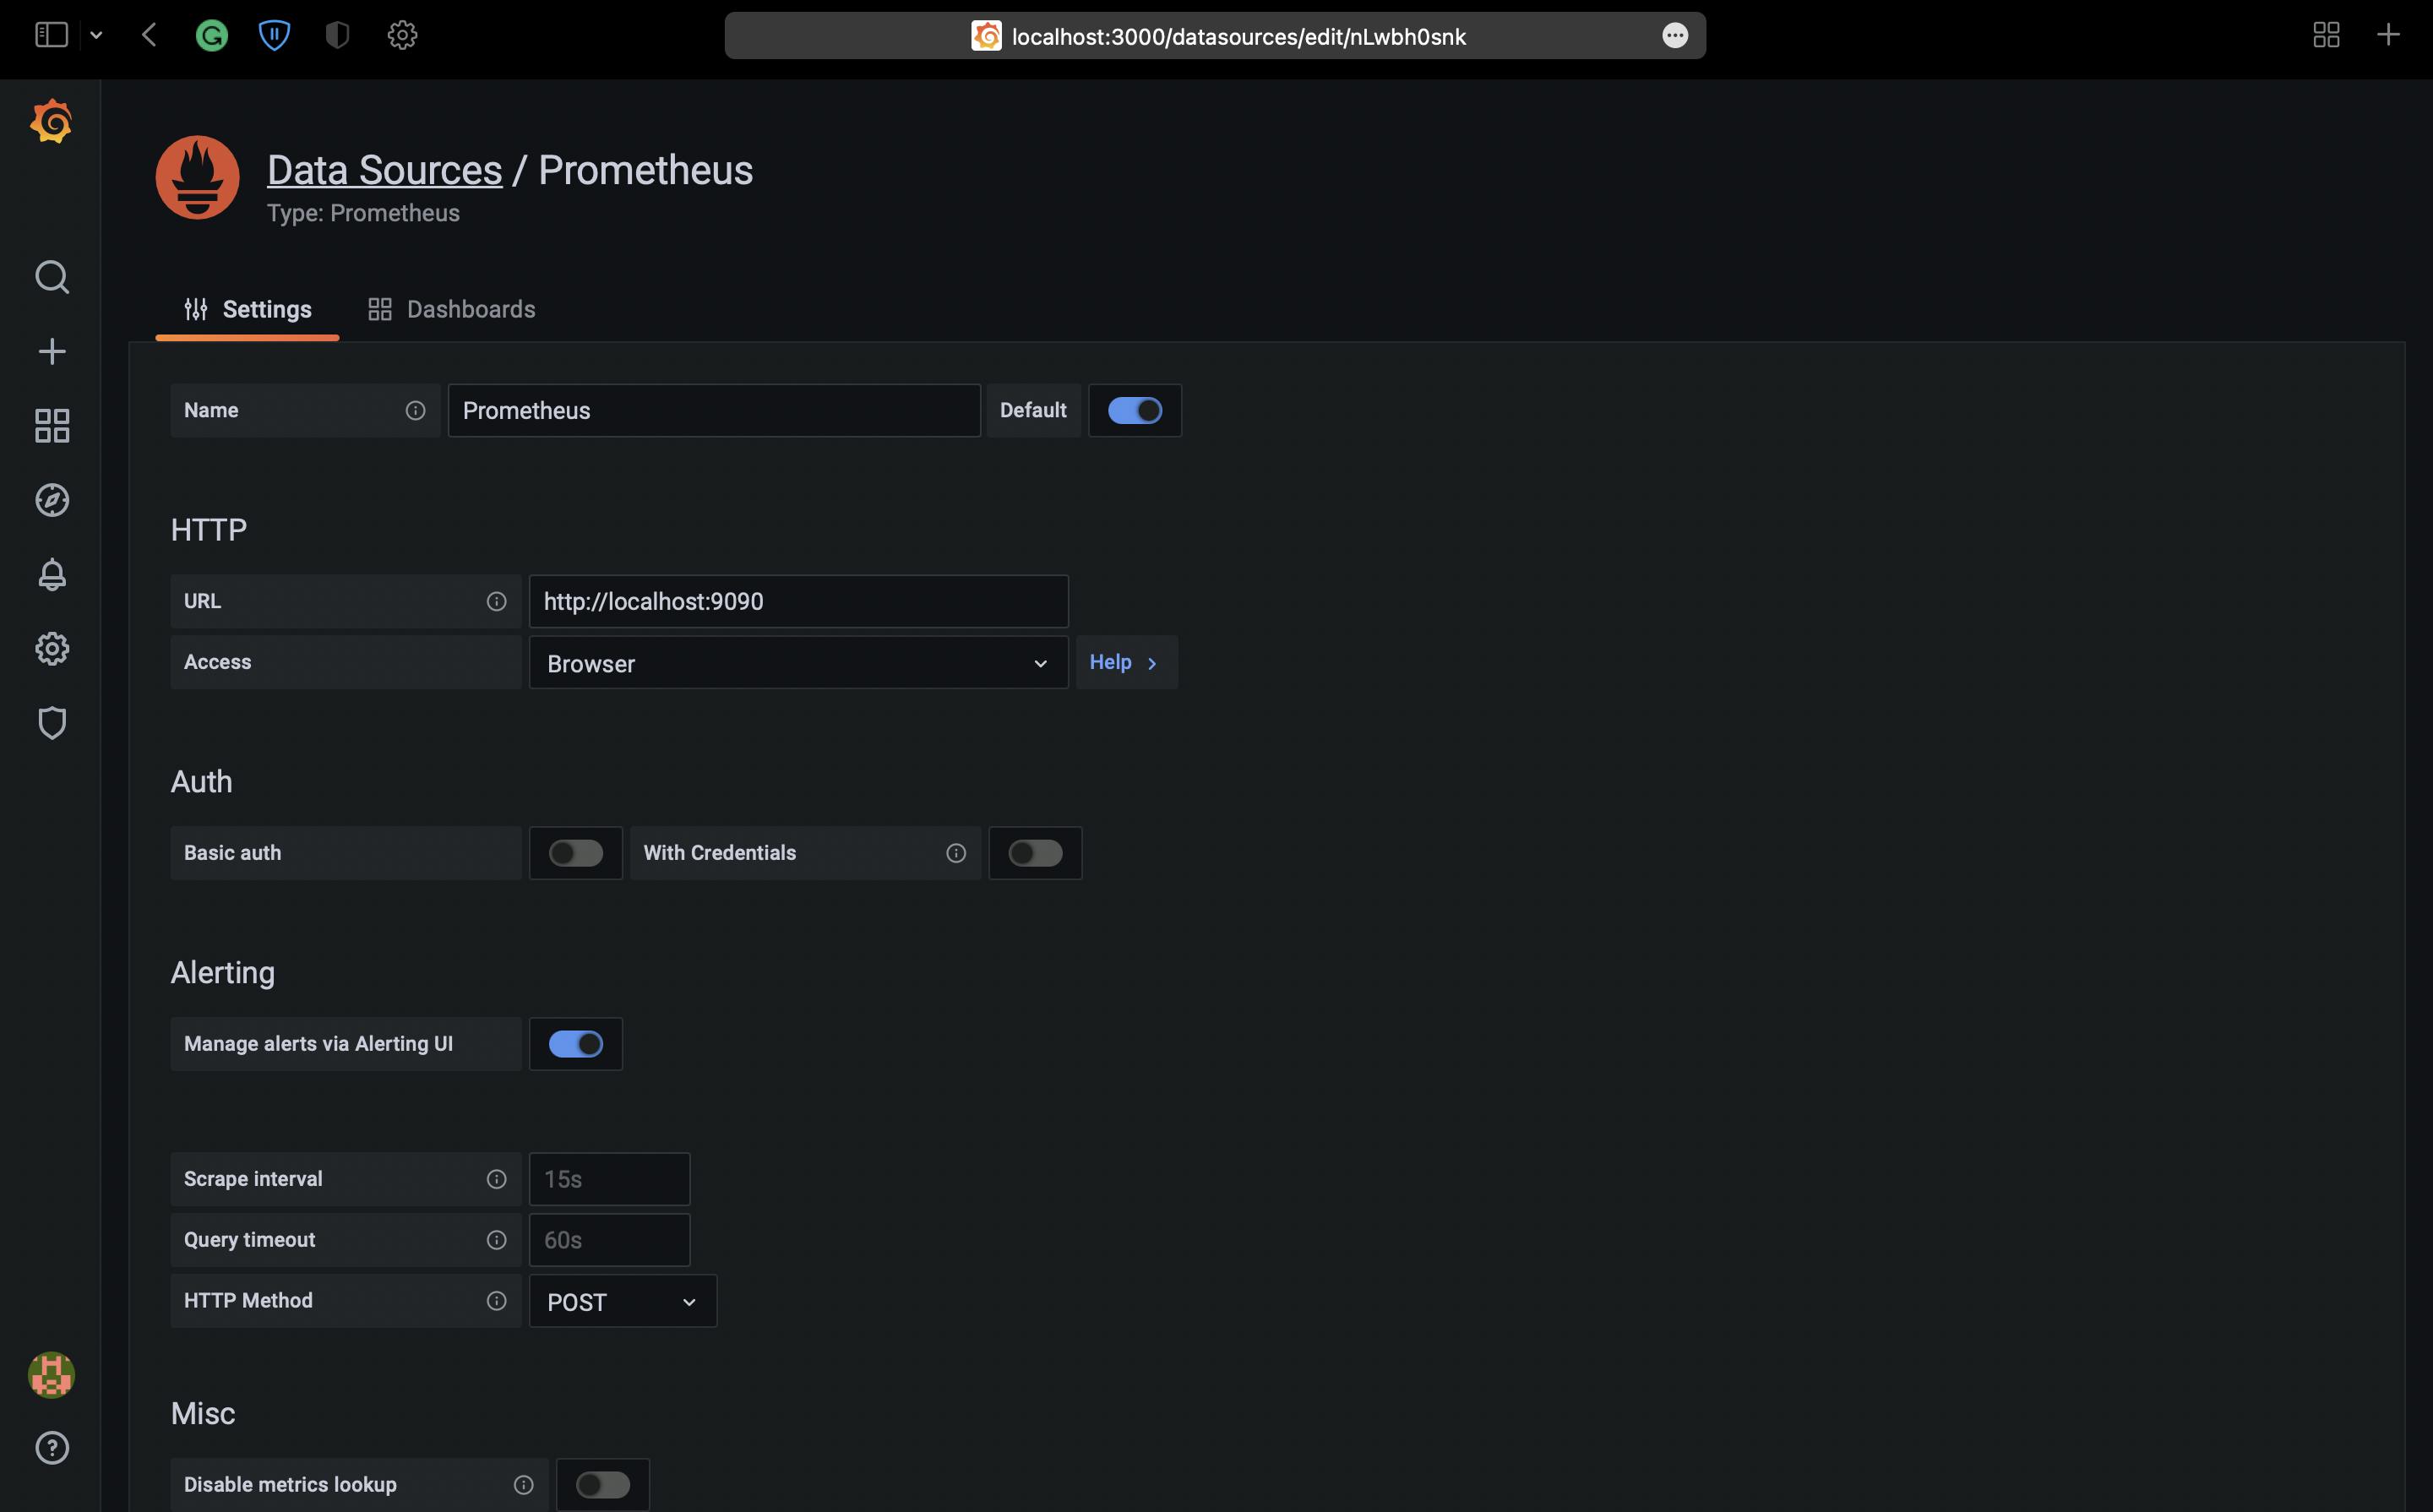
Click on Save, Your data source will be configured.
5. Envision data in Grafana.
Now That we have a data source we will explore the data that is begin fetched.
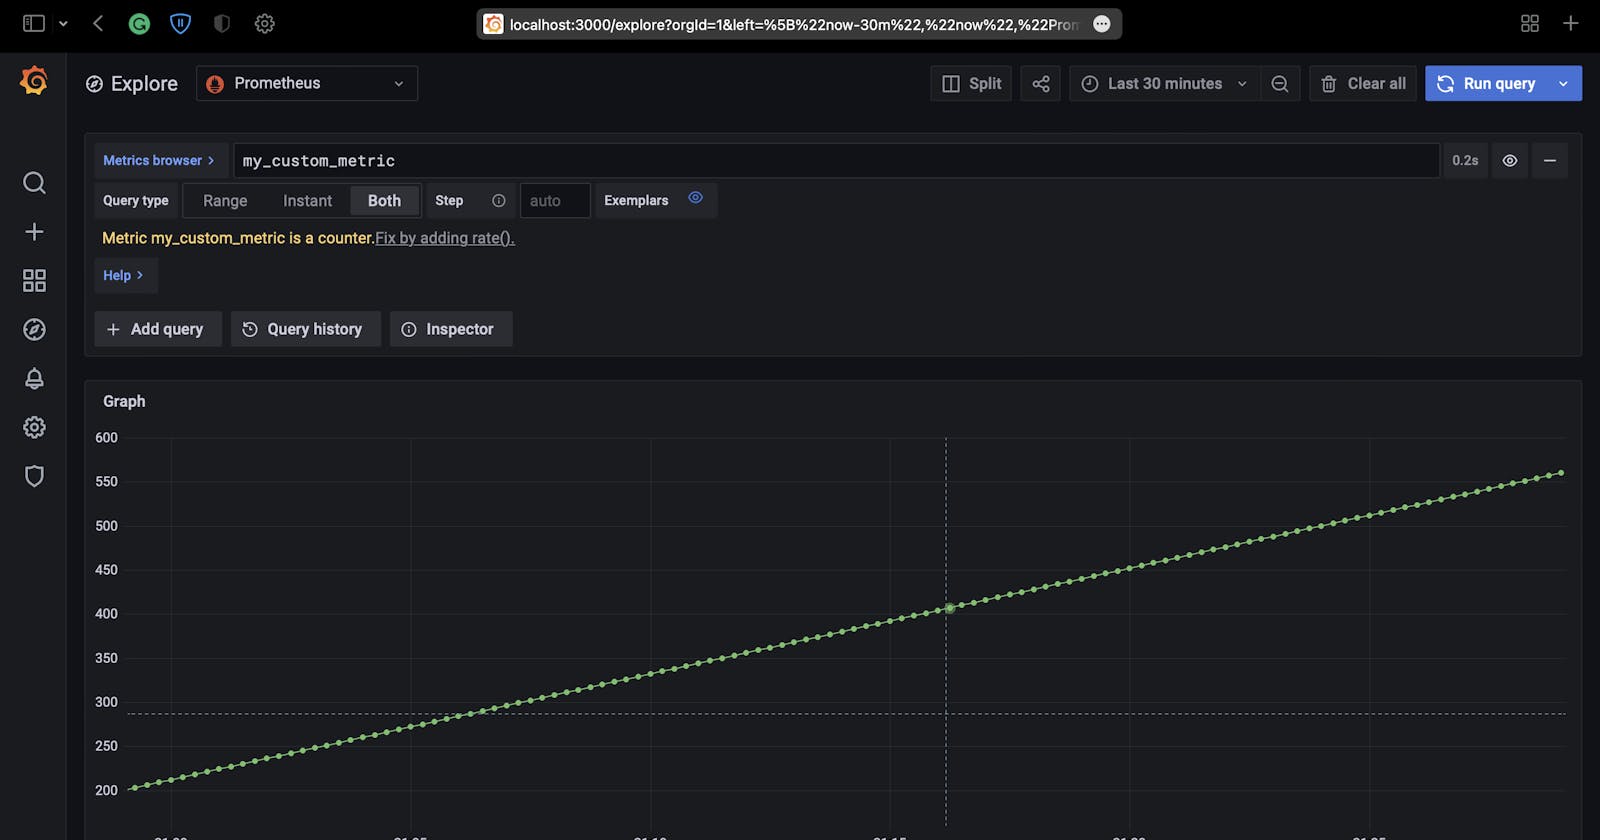
Navigate to Explore and select the Prometheus data source. We can search for the respective metrics that we want to see.
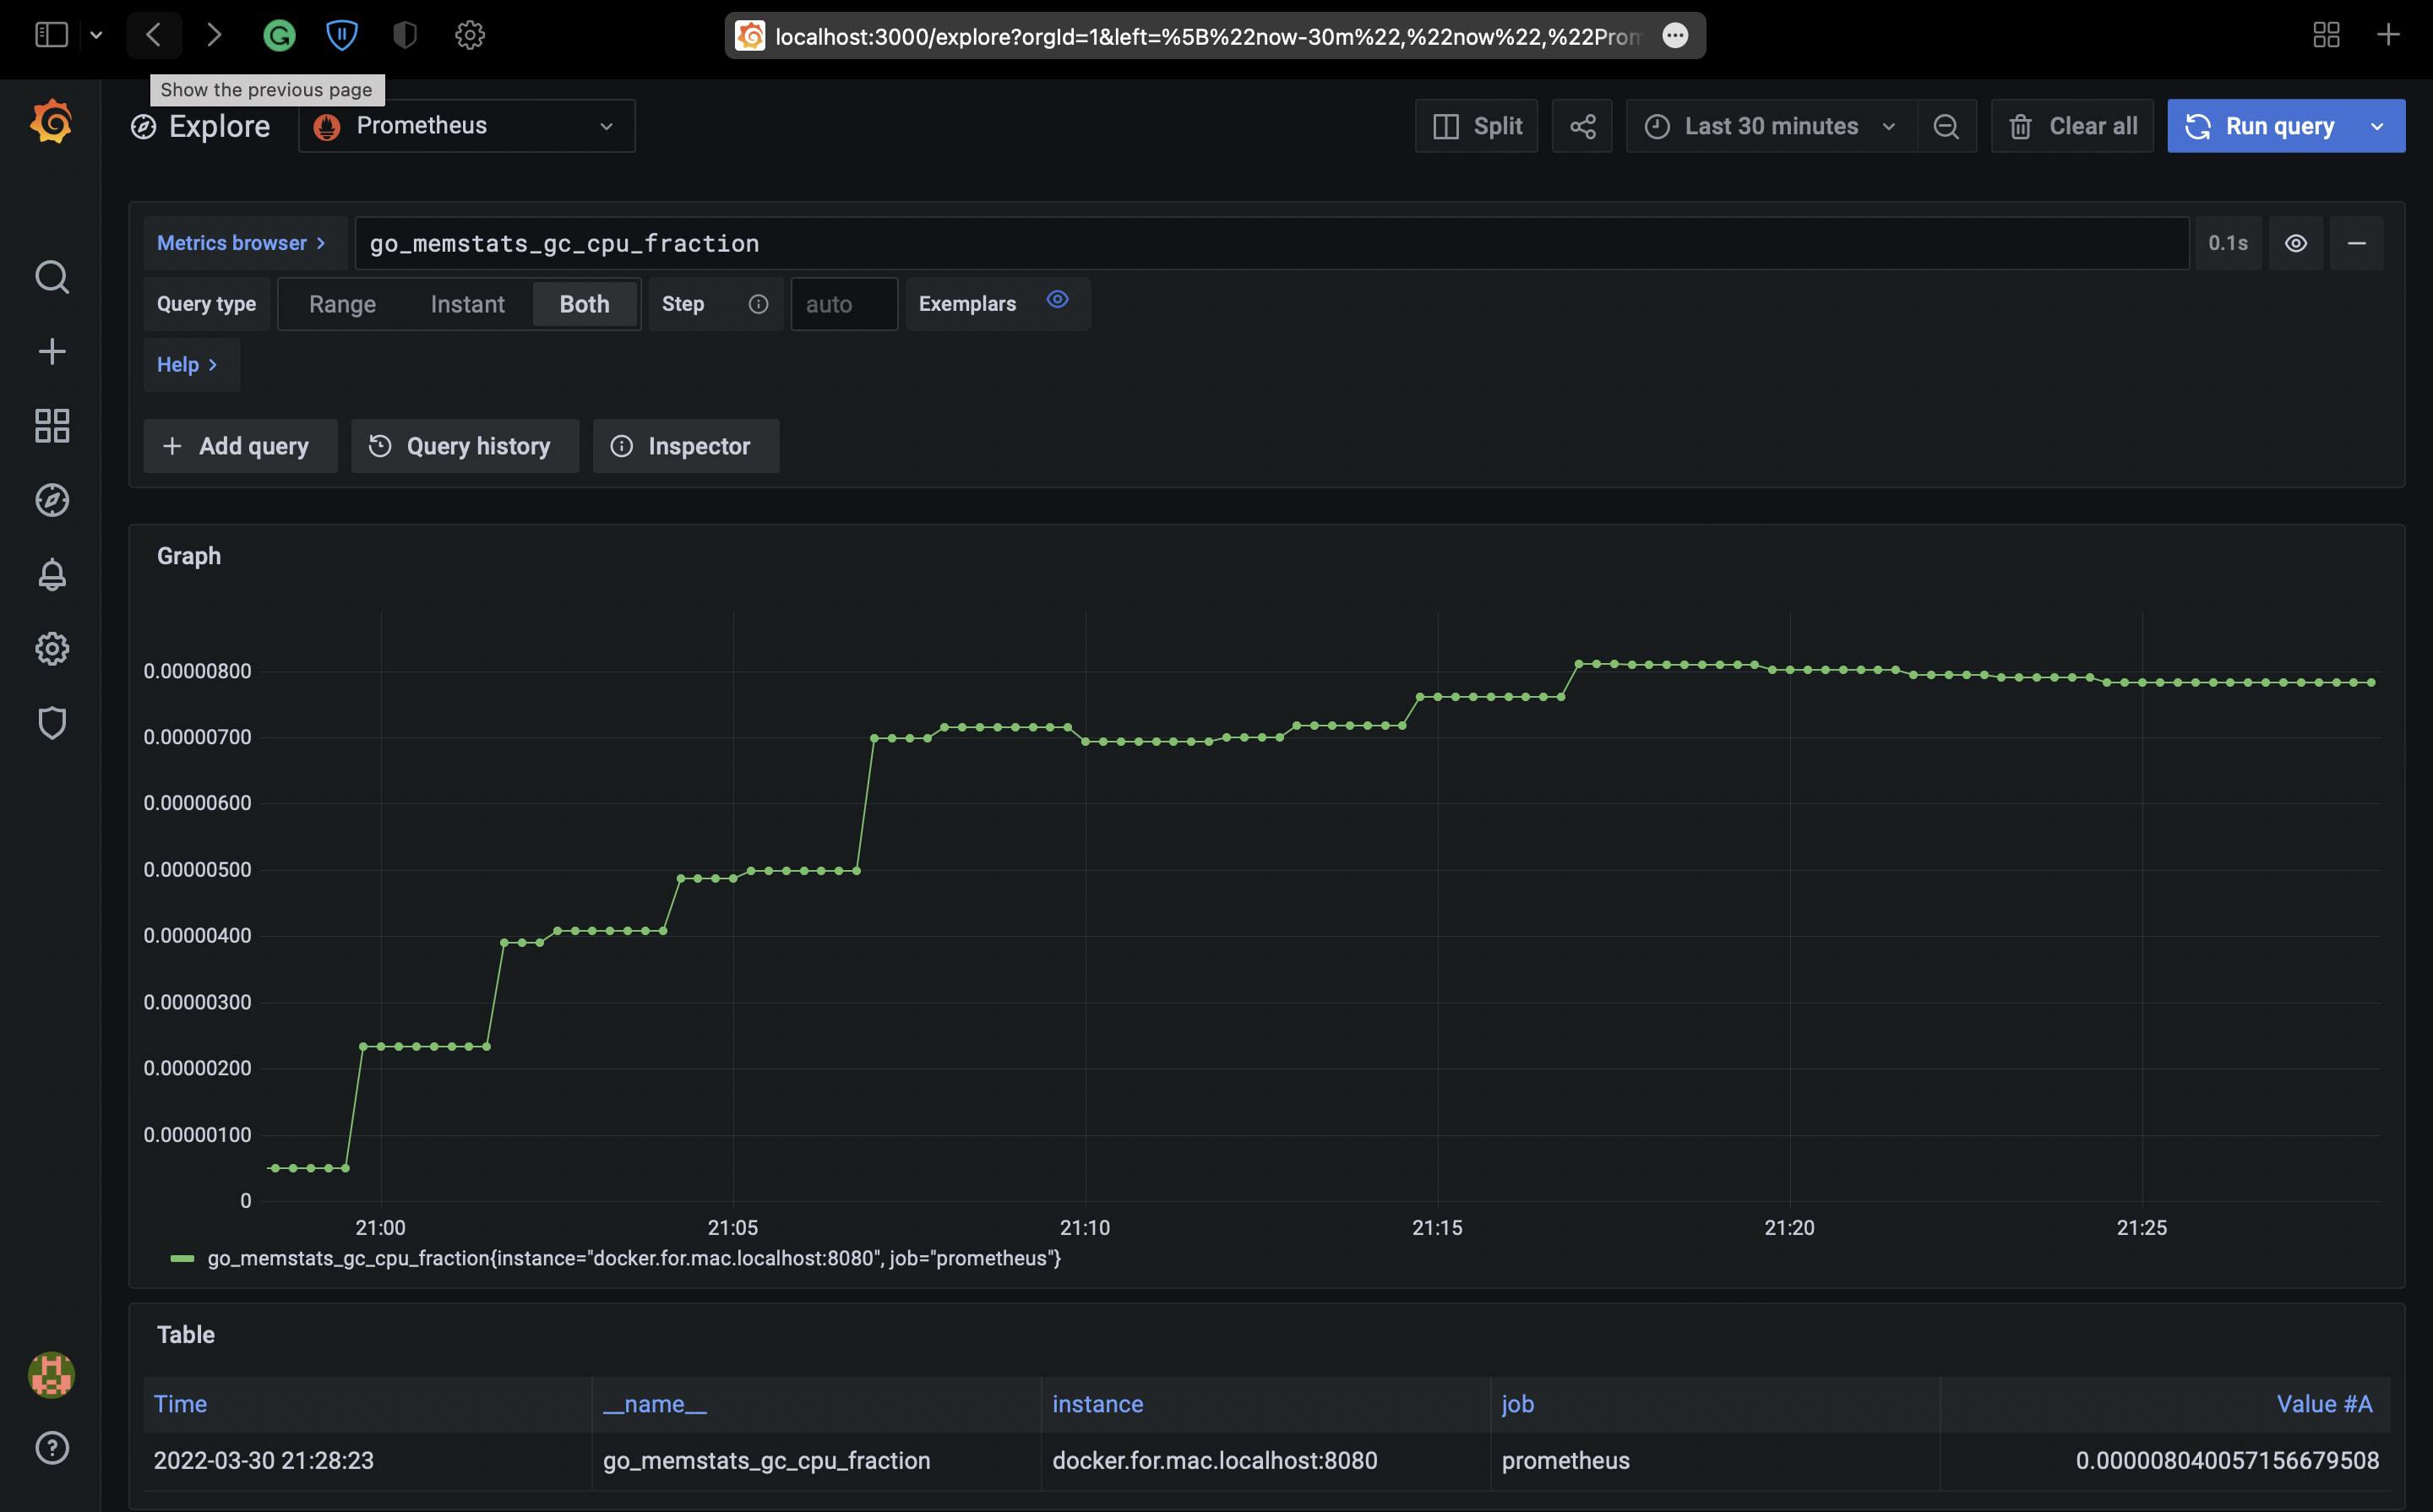
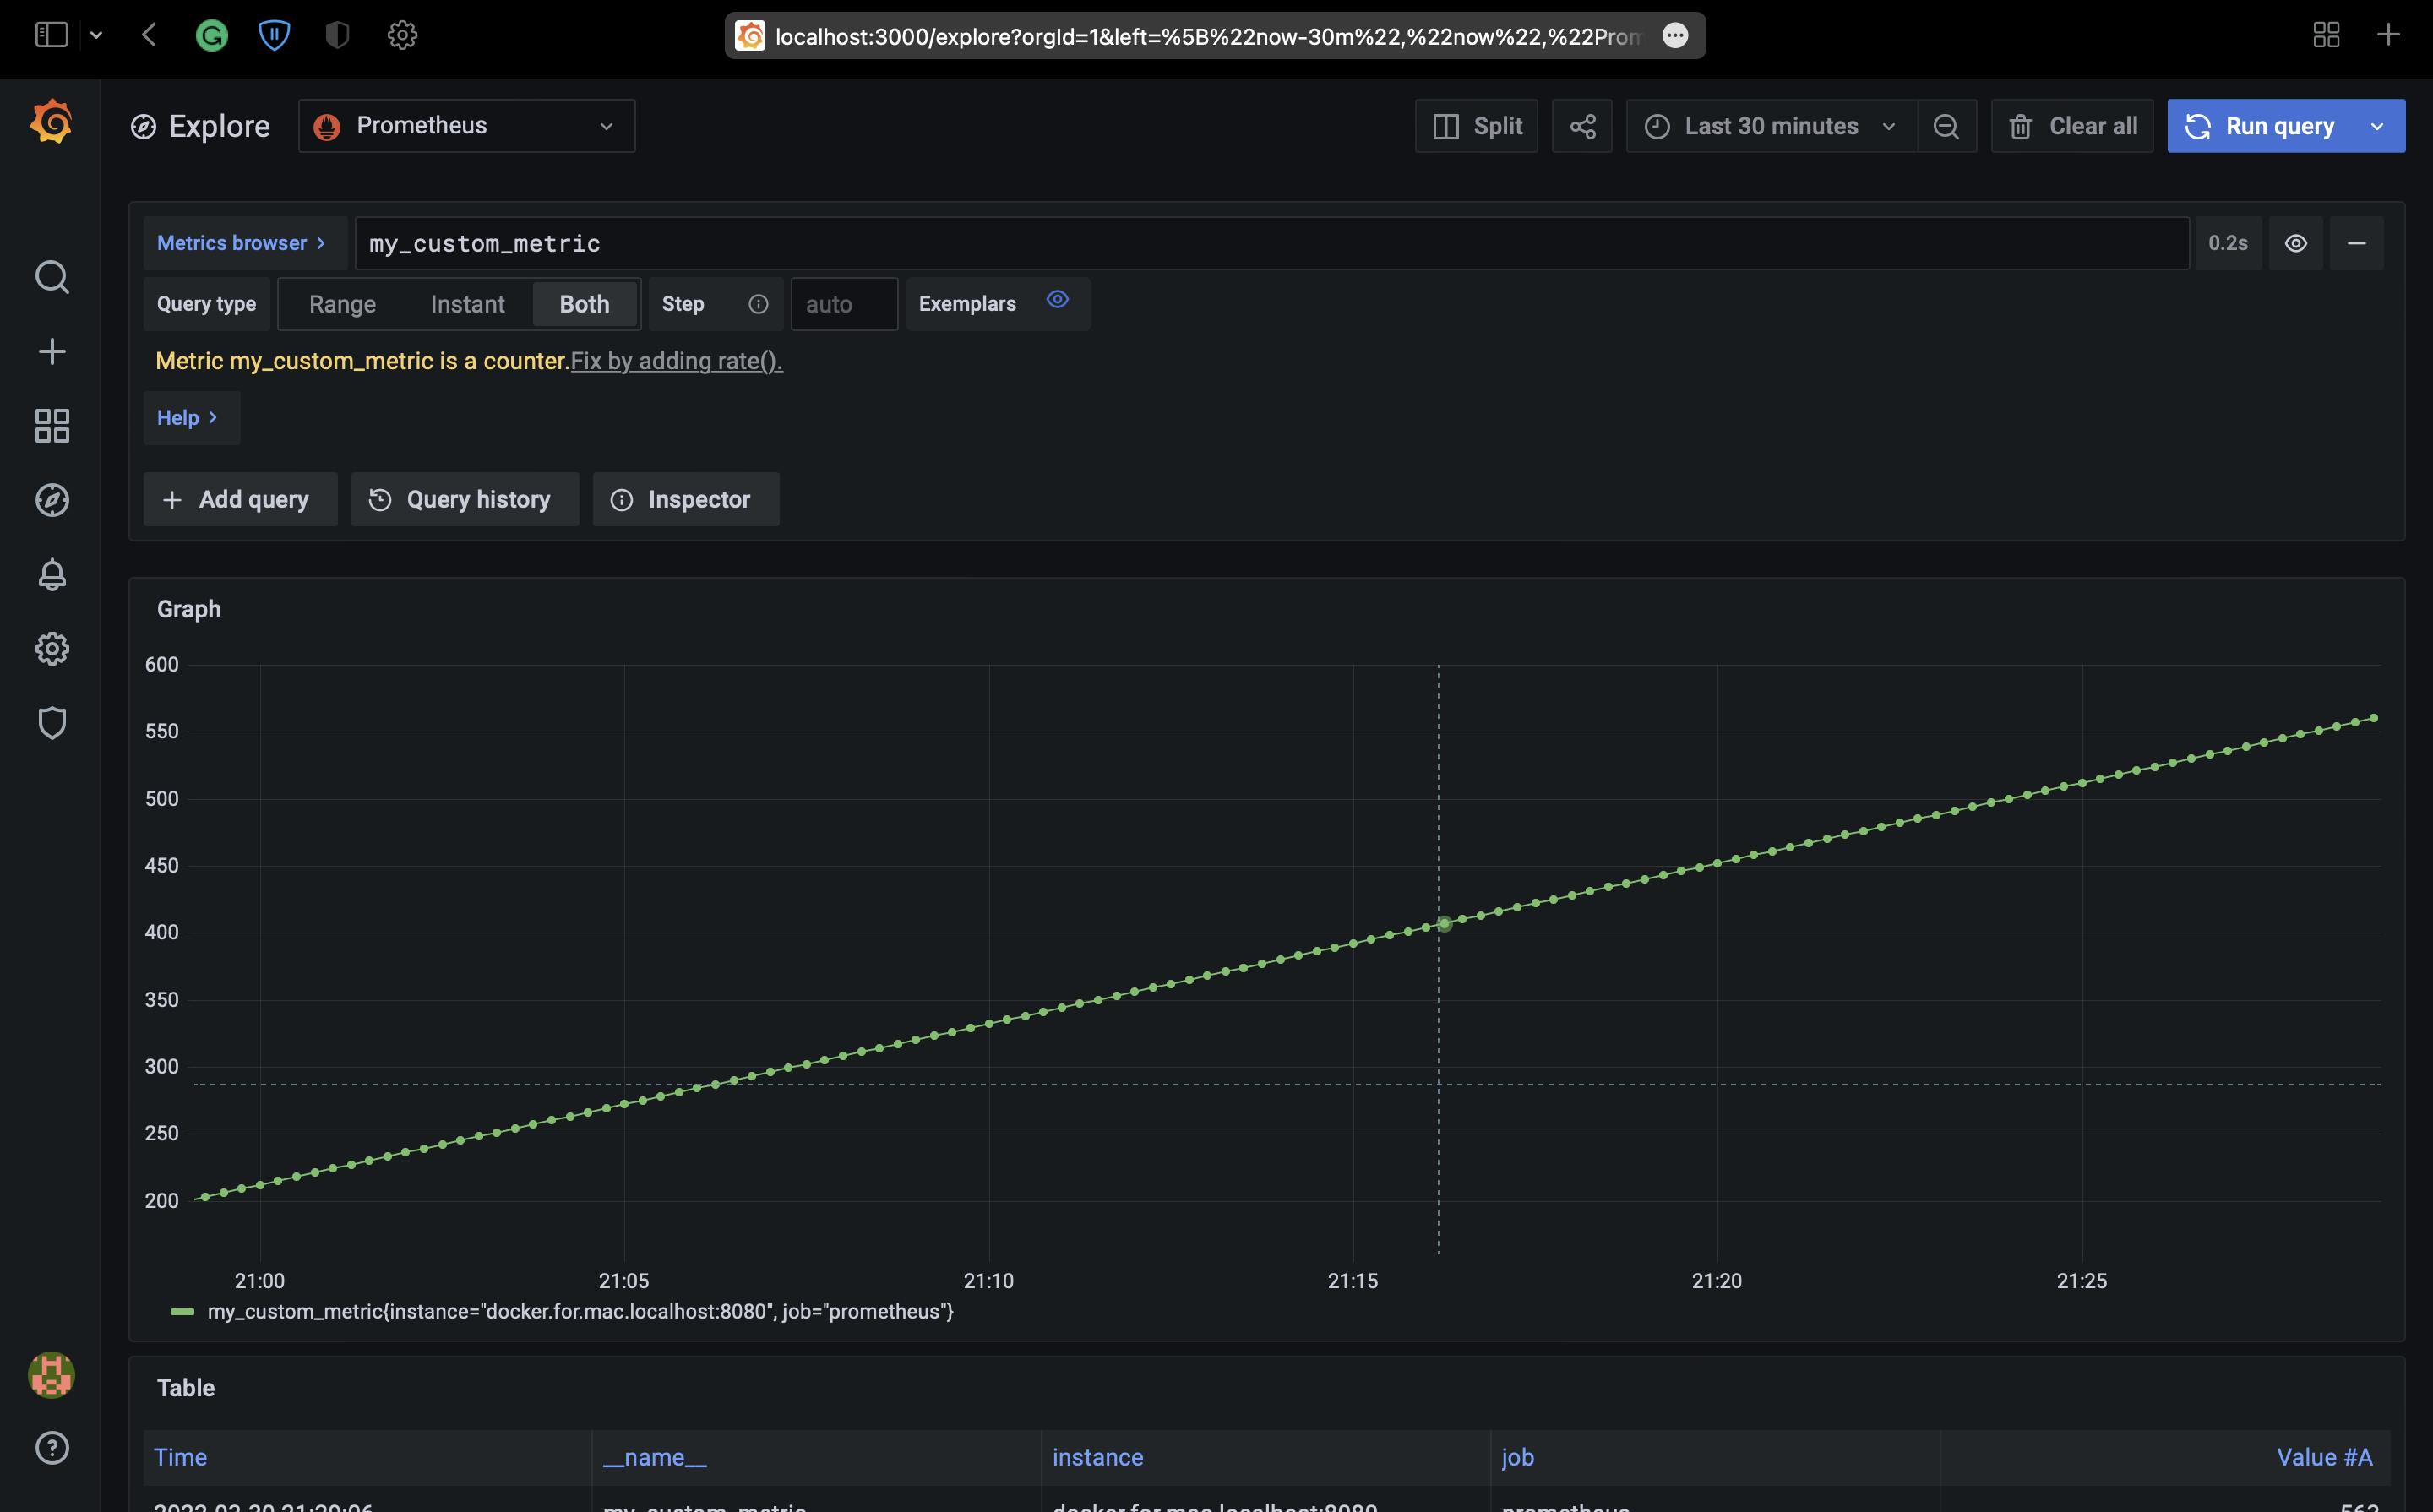
This is the way we can see metrics in Grafana.
Thanks for reading. I hope this story was helpful. If you are interested, check out my other articles.