


Today we will be learning about the Prometheus federation. if you are new to Prometheus, You can go through this blog to learn about instrumenting Prometheus in an application and this blog for configuration of Prometheus server. We will understand how to implement the Prometheus federation.
What is Prometheus Federation?
Prometheus Federation allows a Prometheus server to scrape selected time series from another Prometheus server. it is used to either achieve scalable Prometheus monitoring setups or to pull related metrics from one service's Prometheus into another.
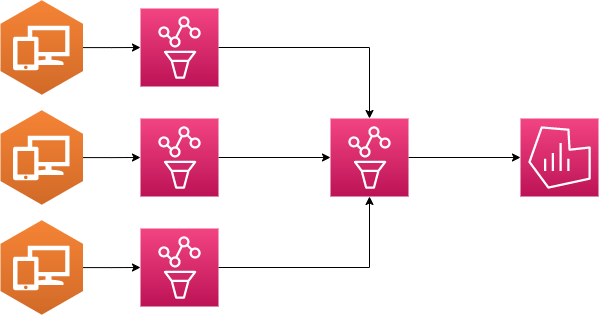
From the above flow diagram, we can see that 3 child Prometheus instances are fetching metrics from 3 different applications. The Prometheus Parent/Federated instance is then fetching and segregating metrics from all the three child instances which then can be visualized in Grafana.
Let's start with the implementation,
1. Configuring a child Prometheus.
The Below configuration will be used by child Prometheus which will pull the metrics from the application and then will be used by Parent Prometheus(federation server).
global:
  scrape_interval: 15s
  external_labels:
    monitor: 'my-app-monitor'
# Scraping the application
- job_name: 'my-application'
  scrape_interval: 5s
  metrics_path: /metrics
  static_configs:
  - targets: ['<my-app-service>:<port>'] #add configuration for you app IP, domain name . service name for apps running in kubernetes
Create all child Prometheus instances as required.
2. Configuring Prometheus Federation.
Create the below configuration for the Prometheus federated instance. This will read the metrics from the child Prometheus. To keep it simple I have only added one match[] filter, Do add filters in match[] to avoid unwanted metrics being pulled to the federation.
scrape_configs:
  - job_name: 'my-app-federation'
    scrape_interval: 20s
    scrape_timeout: 20s

    metrics_path: /federate
    honor_labels: true

    params:
      match[]:
        - '{__name__=~"job:.*"}'
    static_configs:
      - targets: ['child-prometheus1:9090'] #Child prometheus
      - targets: ['child-prometheus2:9090']
      - targets: ['child-prometheus3:9090']
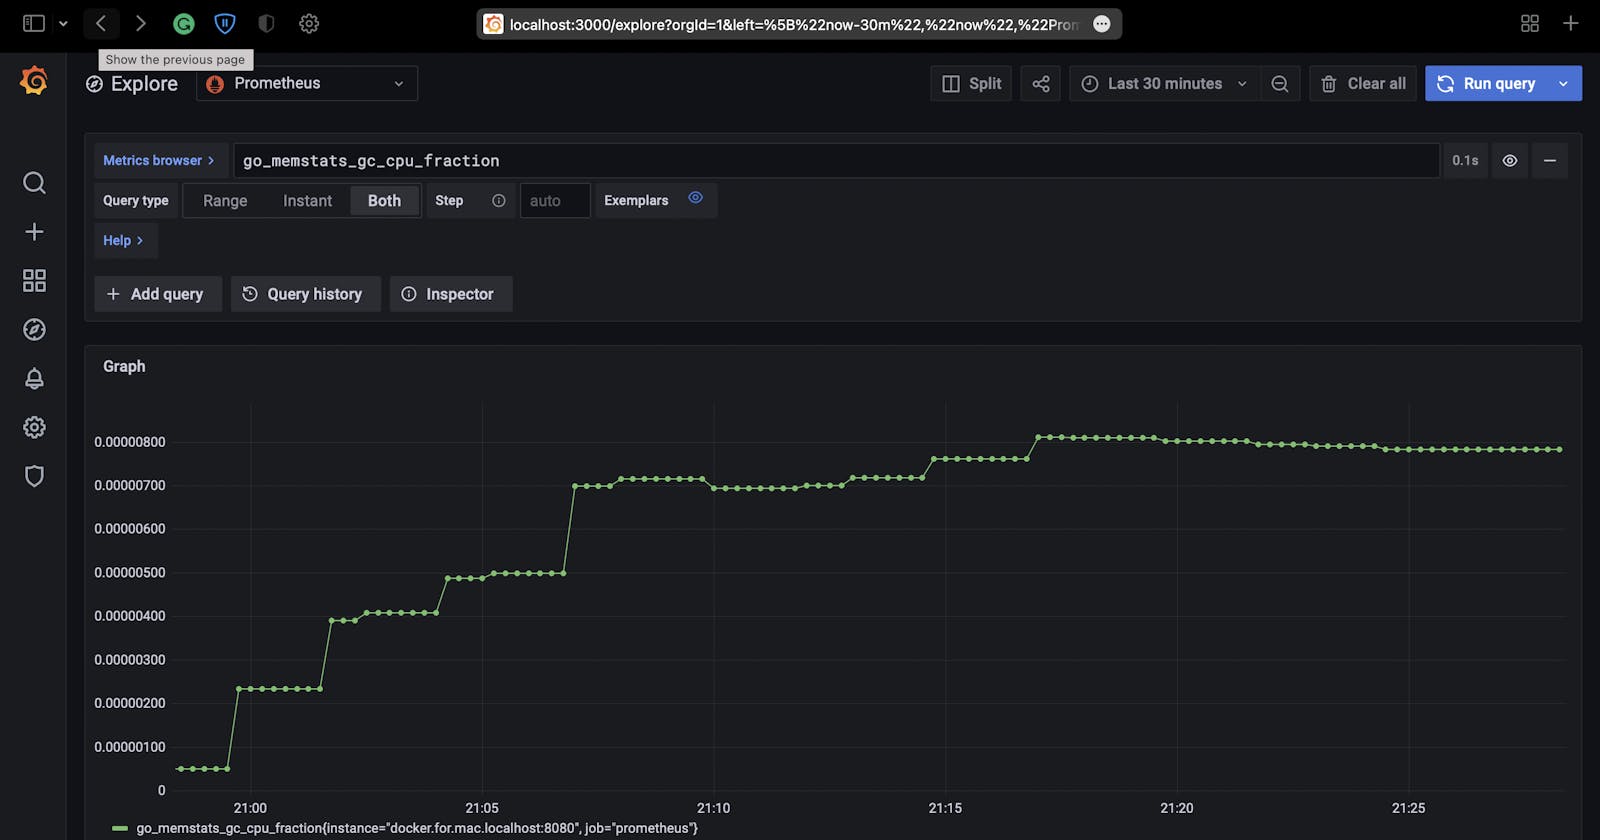
This will start fetching metrics from child instances that can be then visualized in Grafana.
For more information about configuration visit this link.
Thanks for reading. I hope this story was helpful. If you are interested, check out my other articles.