In this blog, we will be integrating Loki, Promtail, and Grafana.
Promtail-Loki-Grafana is an end-to-end logging solution for fetching logs to be visualized at a centralized location.
Before moving into the integration of the services we will start by understanding the role of each component.
Promtail
Promtail is an agent that ships the contents of local logs to a private Grafana Loki instance or Grafana Cloud. It is usually deployed to every machine that has applications needed to be monitored.
It primarily
- Discovers targets
- Attaches labels to log streams
- Pushes them to the Loki instance.
Loki
Loki is a horizontally scalable, highly available, multi-tenant log aggregation system inspired by Prometheus. It is designed to be very cost-effective and easy to operate. It does not index the contents of the logs, but rather a set of labels for each log stream.
Grafana
Grafana is multi-platform open-source analytics and interactive visualization web application. It provides charts, graphs, and alerts for the web when connected to supported data sources.
Overview
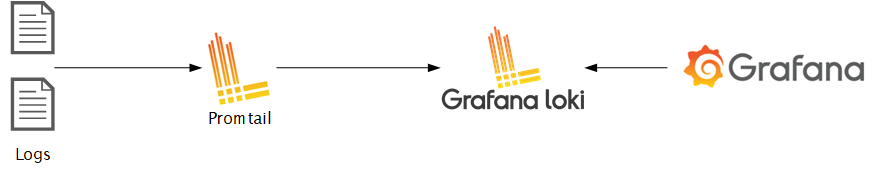
The log files will be fetched from the machine by Promtail instance which will be pushed to the Loki instance. Loki will segregate the logs and attach labels to those. once the logs are available at Loki we can add a data source to Grafana to visualize those. we can see the end-to-end configuration below. we will be using docker-compose for the deployment of all components.
1. Create Promtail configuration
promtail-config.yaml
--------------------------------------------------------------------
server:
http_listen_port: 9080
grpc_listen_port: 0
clients:
- url: http:
scrape_configs:
- job_name: myapplogs
static_configs:
- targets:
- localhost
labels:
job: varlogs
__path__: /var/log
Configure the push API for Loki under the URL field.
Adding the path with the path of the log file that needs monitoring.
2. Create Loki Configuration
loki-config.yaml
--------------------------------------------------------------------
auth_enabled: false
server:
http_listen_port: 3100
grpc_listen_port: 9096
ingester:
wal:
enabled: true
dir: /tmp/wal
lifecycler:
address: 127.0.0.1
ring:
kvstore:
store: inmemory
replication_factor: 1
final_sleep: 0s
chunk_idle_period: 1h
max_chunk_age: 1h
chunk_target_size: 1048576
chunk_retain_period: 30s
max_transfer_retries: 0
schema_config:
configs:
- from: 2020-10-24
store: boltdb-shipper
object_store: filesystem
schema: v11
index:
prefix: index_
period: 24h
storage_config:
boltdb_shipper:
active_index_directory: /tmp/loki/boltdb-shipper-active
cache_location: /tmp/loki/boltdb-shipper-cache
cache_ttl: 24h
shared_store: filesystem
filesystem:
directory: /tmp/loki/chunks
compactor:
working_directory: /tmp/loki/boltdb-shipper-compactor
shared_store: filesystem
limits_config:
reject_old_samples: true
reject_old_samples_max_age: 168h
chunk_store_config:
max_look_back_period: 0s
table_manager:
retention_deletes_enabled: false
retention_period: 0s
ruler:
storage:
type: local
local:
directory: /tmp/loki/rules
rule_path: /tmp/loki/rules-temp
alertmanager_url: http://localhost:9093
ring:
kvstore:
store: inmemory
enable_api: true
For this demo, we will store the data in-memory. Other stores that can be used are;
- Amazon DynamoDB
- Google Bigtable
- Apache Cassandra
- Amazon S3
- Google Cloud Storage
3. Create Docker Compose file
docker-compose.yml
--------------------------------------------------------------------
version: "3"
networks:
  loki:
services:
  loki:
    image: grafana/loki:latest
    ports:
      - "3100:3100"
    volumes:
      - /etc/loki:/etc/loki
    command: -config.file=/etc/loki/loki-config.yaml
    networks:
      - loki
promtail:
    image: grafana/promtail:latest
    volumes:
      - /etc/promtail:/var/log
      - /etc/promtail:/etc/promtail
    command: -config.file=/etc/promtail/promtail-config.yaml
    networks:
      - loki
grafana:
    image: grafana/grafana:latest
    ports:
      - "3000:3000"
    networks:
      - loki
Configuring all the services with a common network. for this example it is Loki.
Add Volumes to all services to get the config files and log files.
Add port mapping to Loki and Grafana.
4. Running the Docker file.
docker-compose up
Run the above command in the directory where the docker-compose file is present. Once you run it all the containers will spin up’
⠿ Container promtail-loki-grafana-using-docker-compose-loki-1      Created                                                                      0.0s
 ⠿ Container promtail-loki-grafana-using-docker-compose-promtail-1  Created                                                                      0.0s
 ⠿ Container promtail-loki-grafana-using-docker-compose-grafana-1   Created
5. test the services
Test Loki services by hitting http://localhost:3100/ready
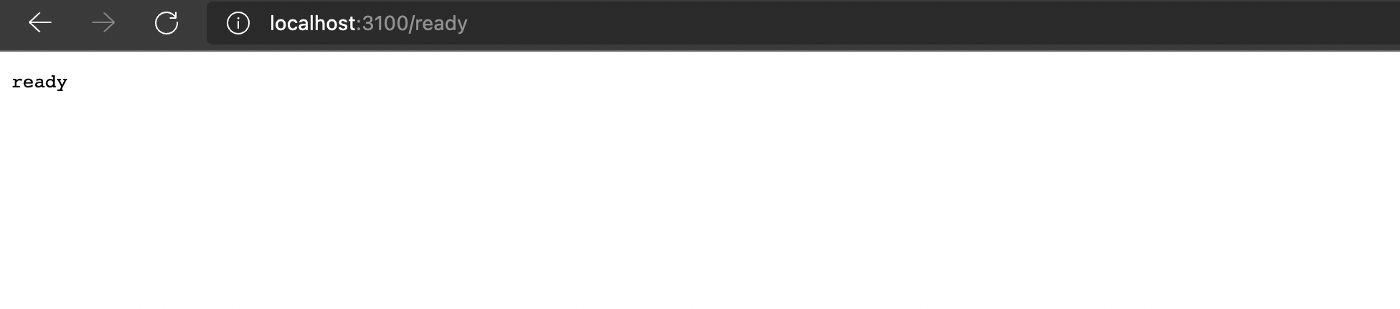 if you got the above response your Loki and Promtail are configured successfully.
Adding Loki as the data source in Grafana
login to http://localhost:3000/.
default password: admin
default user: admin
Add Loki URL in the data source configuration.
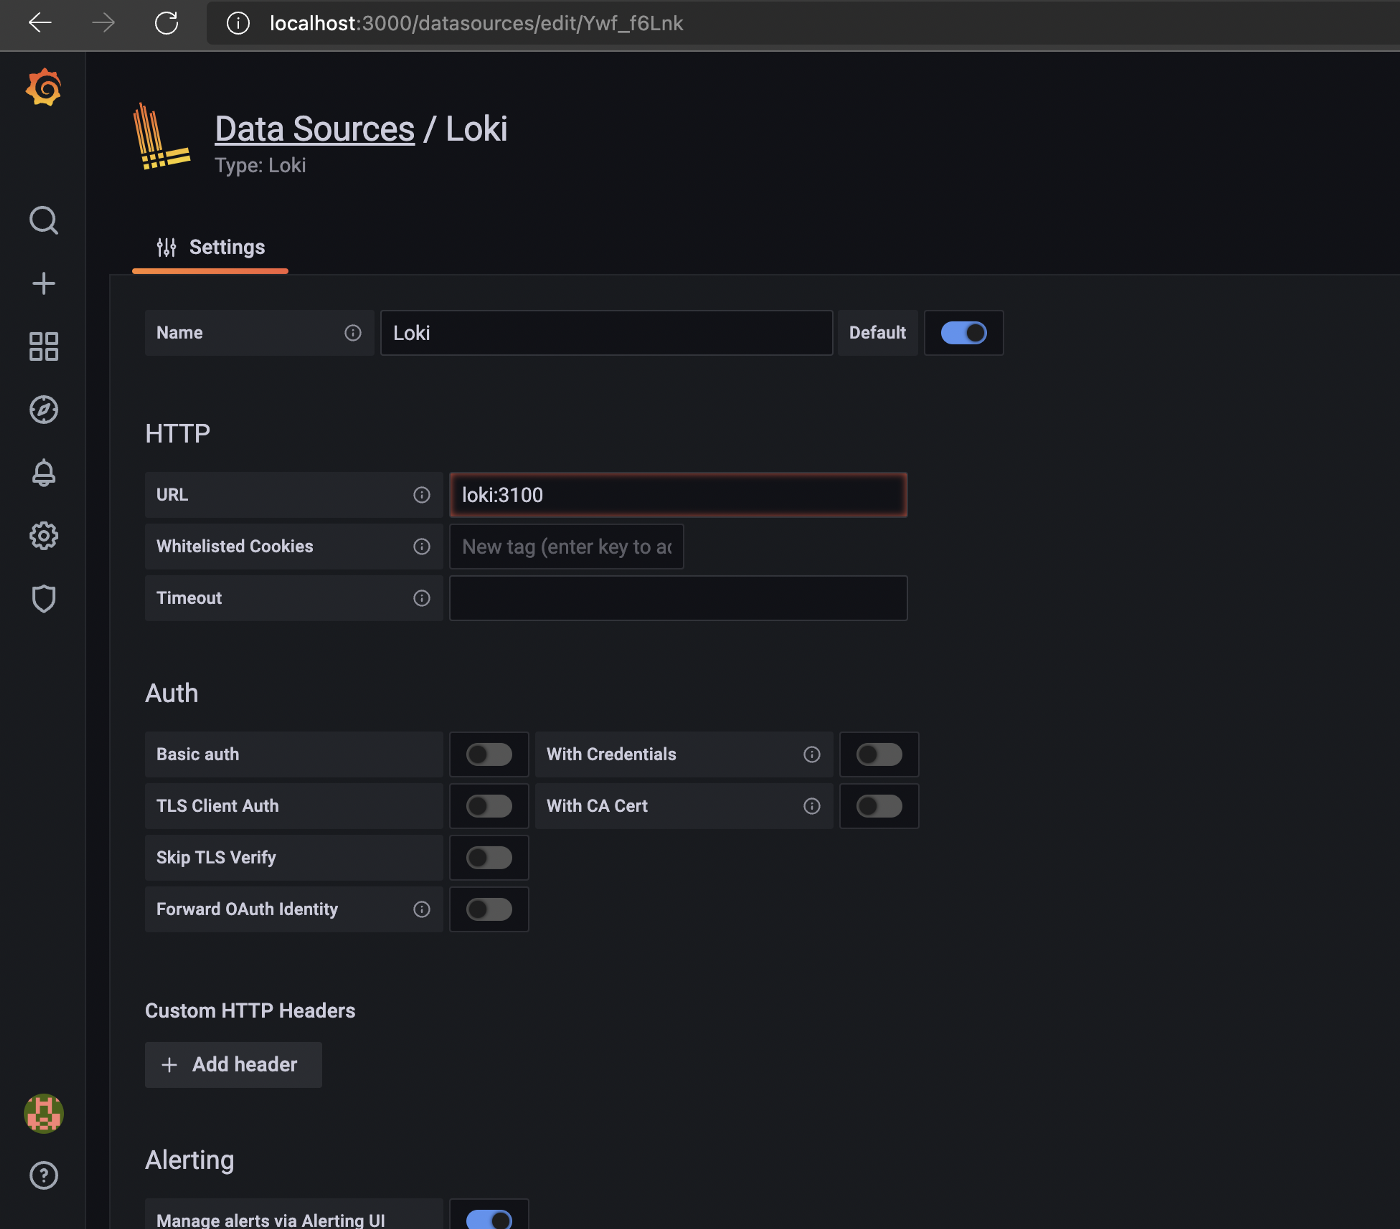 Save and test the connection.
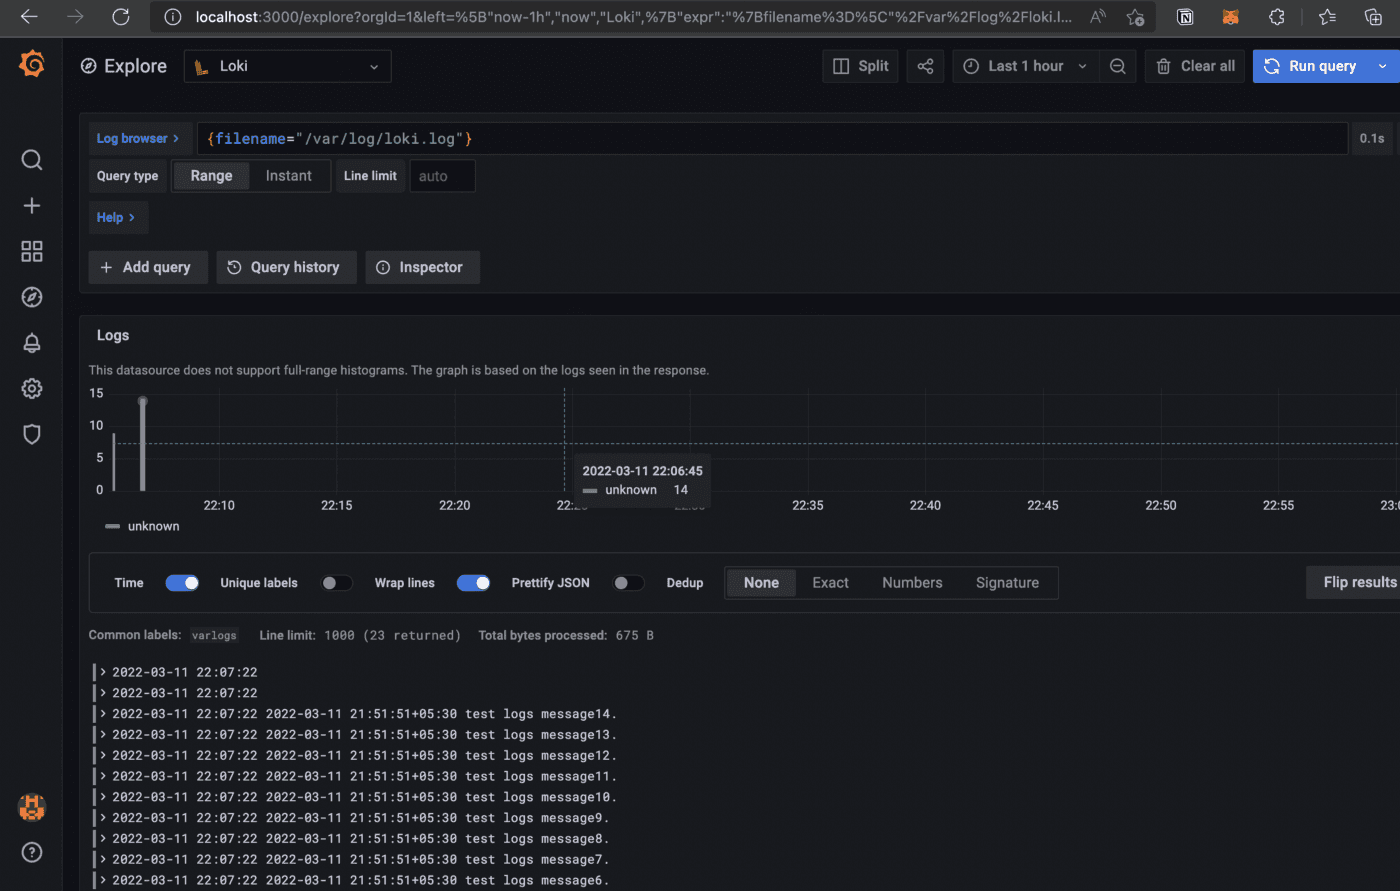
6. Visualize the log.
Click on explore and select Loki as a data source. add required filters to get the exact log file.
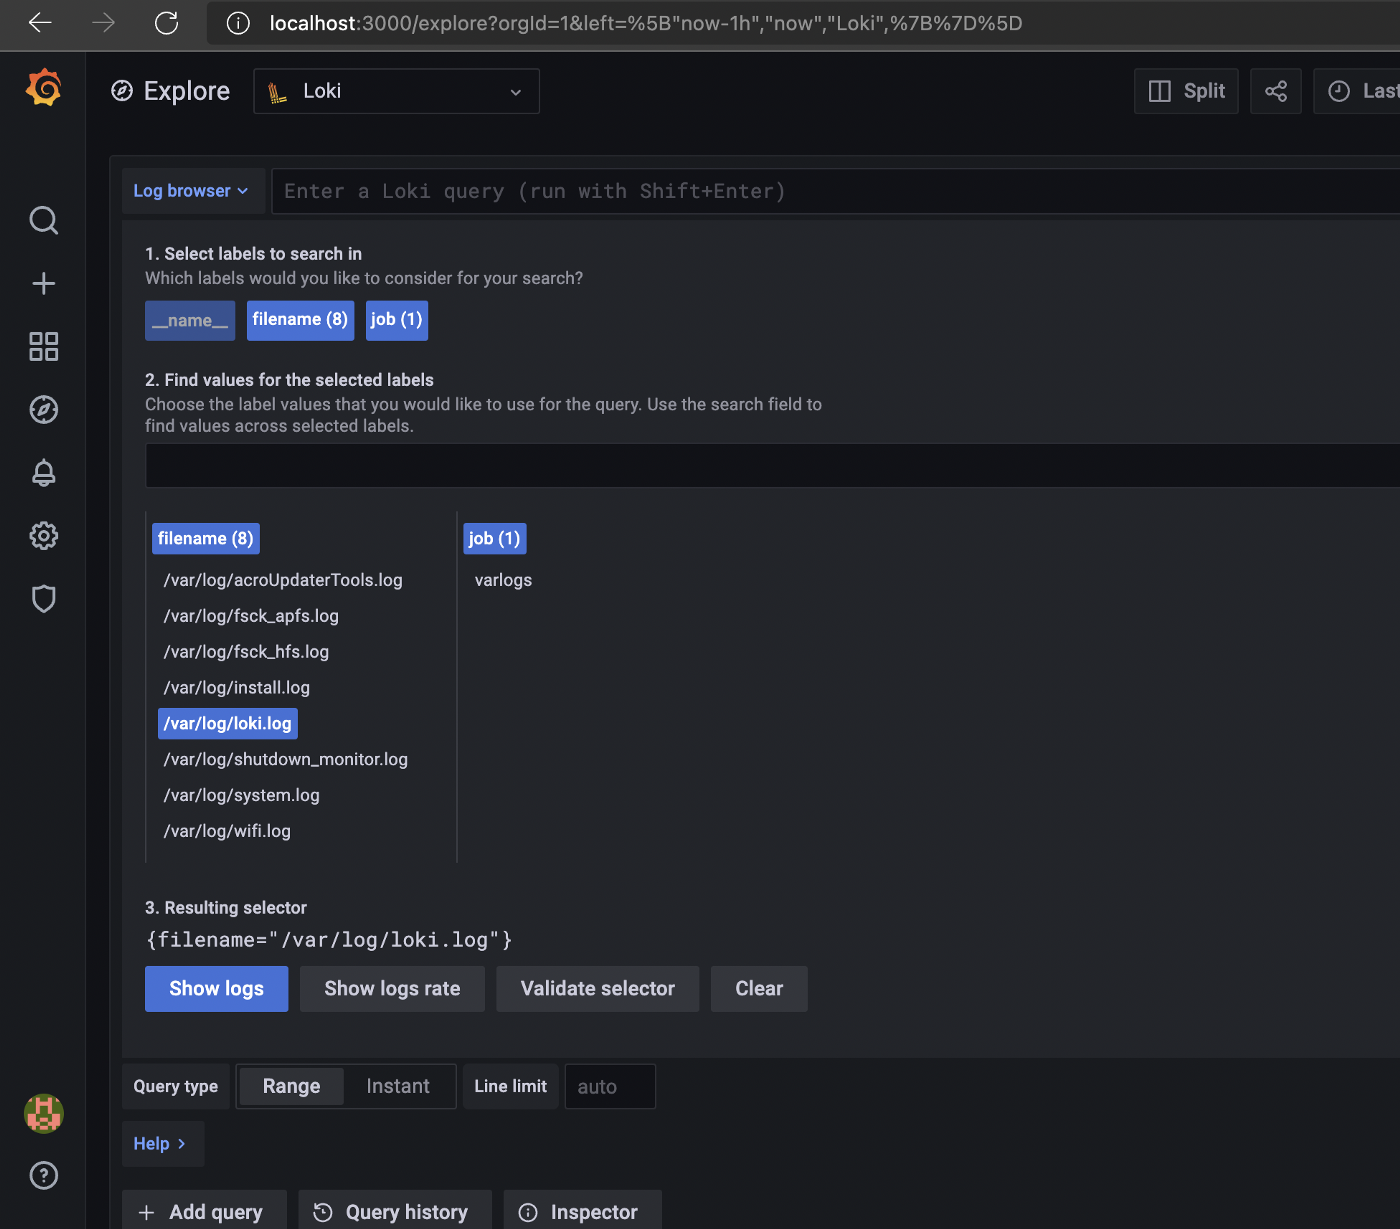
click on show logs.
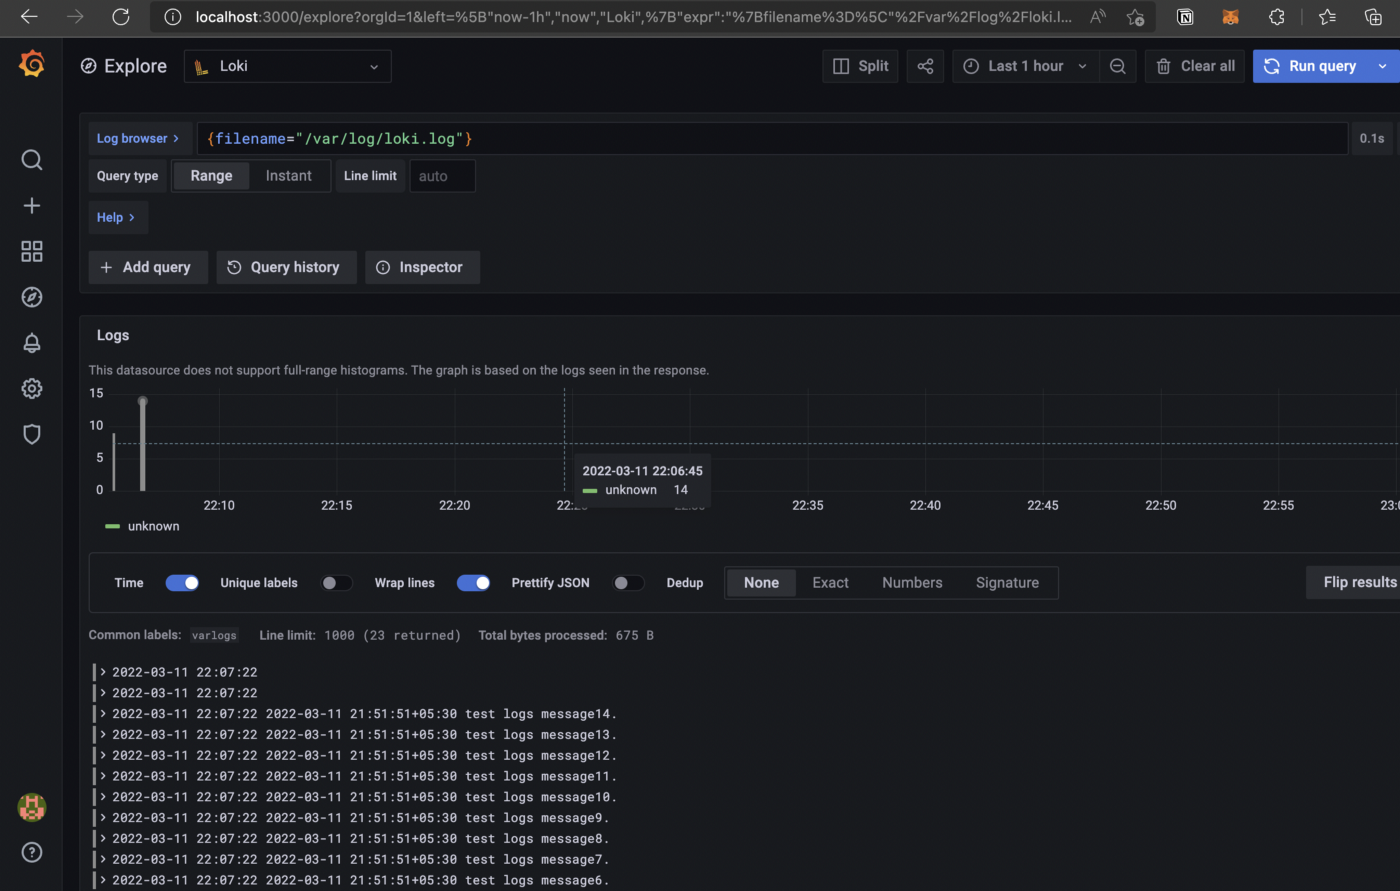
Finally, the logs can be seen in the dashboard.
Thanks for reading. I hope this story was helpful. If you are interested, check out my other articles.